14 Fleet management key performance indicators you should track to boost efficiency
Discover the 14 key fleet management KPIs every manager should track to boost efficiency, reduce costs, and keep vehicles safe and on the road. Learn why monitoring these metrics is critical for running a successful fleet.
By Geotab Team
Dec 1, 2025

Fleet management key performance indicators (KPIs) are essential data points that fleet managers use to track and understand fleet performance. They typically fall into one of four main categories: cost management, vehicle and asset utilization, driver performance, and safety and operational efficiency.
Creating or optimizing your fleet efficiency goals and key performance indicators (KPIs) is a great way to stay ahead on fleet maintenance management and running a safe, productive fleet.
As a fleet telematics provider, we know that creating or optimizing your fleet efficiency goals and fleet management key performance indicators (KPIs) is a powerful way to stay ahead in fleet maintenance management. Doing so helps reduce downtime and keeps your fleet safe and productive.
Let’s take a closer look at some fleet efficiency goals and KPIs from a vehicle maintenance and repair perspective.
Cost management KPIs
Cost management KPIs are metrics that track the expenses associated with running a fleet. Monitoring these fleet management KPIs helps ensure profitability by identifying areas where costs can be reduced and resources can be used more efficiently.
1. Cost per mile operations and maintenance
According to the American Transportation Research Institute, the average cost per mile for transport trucks was $2.26 in 2024 or $113 per hour. This represents an increase of $0.62 per mile compared with 2020. Primary transportation costs include fuel, driver salaries, and vehicle maintenance.
Fleet cost per mile is calculated as:
Cost Per Mile = Total Cost Of Ownership / Total Miles Driven
The total cost of ownership (TCO) includes fixed costs such as insurance and licenses, along with variable costs like fuel, tolls and mileage-based maintenance. Tracking this KPI helps identify spending trends and improve cost efficiency.
Maintenance and repair costs for light trucks and cars vary widely based on the vast range of vehicle and fuel types. The more miles vehicles are driven, the lower cost per mile will (or should) be. You will need to measure your cost per mile per class basis, look for the outliers and constantly measure and improve this metric over time.
Geotab’s telematics data helps you track these measurements and improve over time.
Consider implementing some of these additional goals and metrics when running your fleet:
- Inventory turns year over year
- Employee satisfaction rate
- Miles per gallon
- The total cost of ownership
- Driver behavior (harsh turning and braking, speeding)
- Warranty recovery rate and savings
2. Scheduled maintenance and repair costs
Scheduled maintenance and repair costs measure how effectively your fleet is managing preventive maintenance (PM). This metric aligns directly with your PM goals and helps track the balance between scheduled and unscheduled repairs. To run a successful fleet, aim for about 60% of maintenance work to be scheduled.
If you notice a rise in unscheduled repairs, review your PM metrics and identify areas for improvement. For example, strengthen communication with drivers and clients by providing clearer maintenance instructions or increasing check-ins.
Consistent scheduled maintenance reduces the risk of critical issues being overlooked and prevents costly, unexpected repairs.
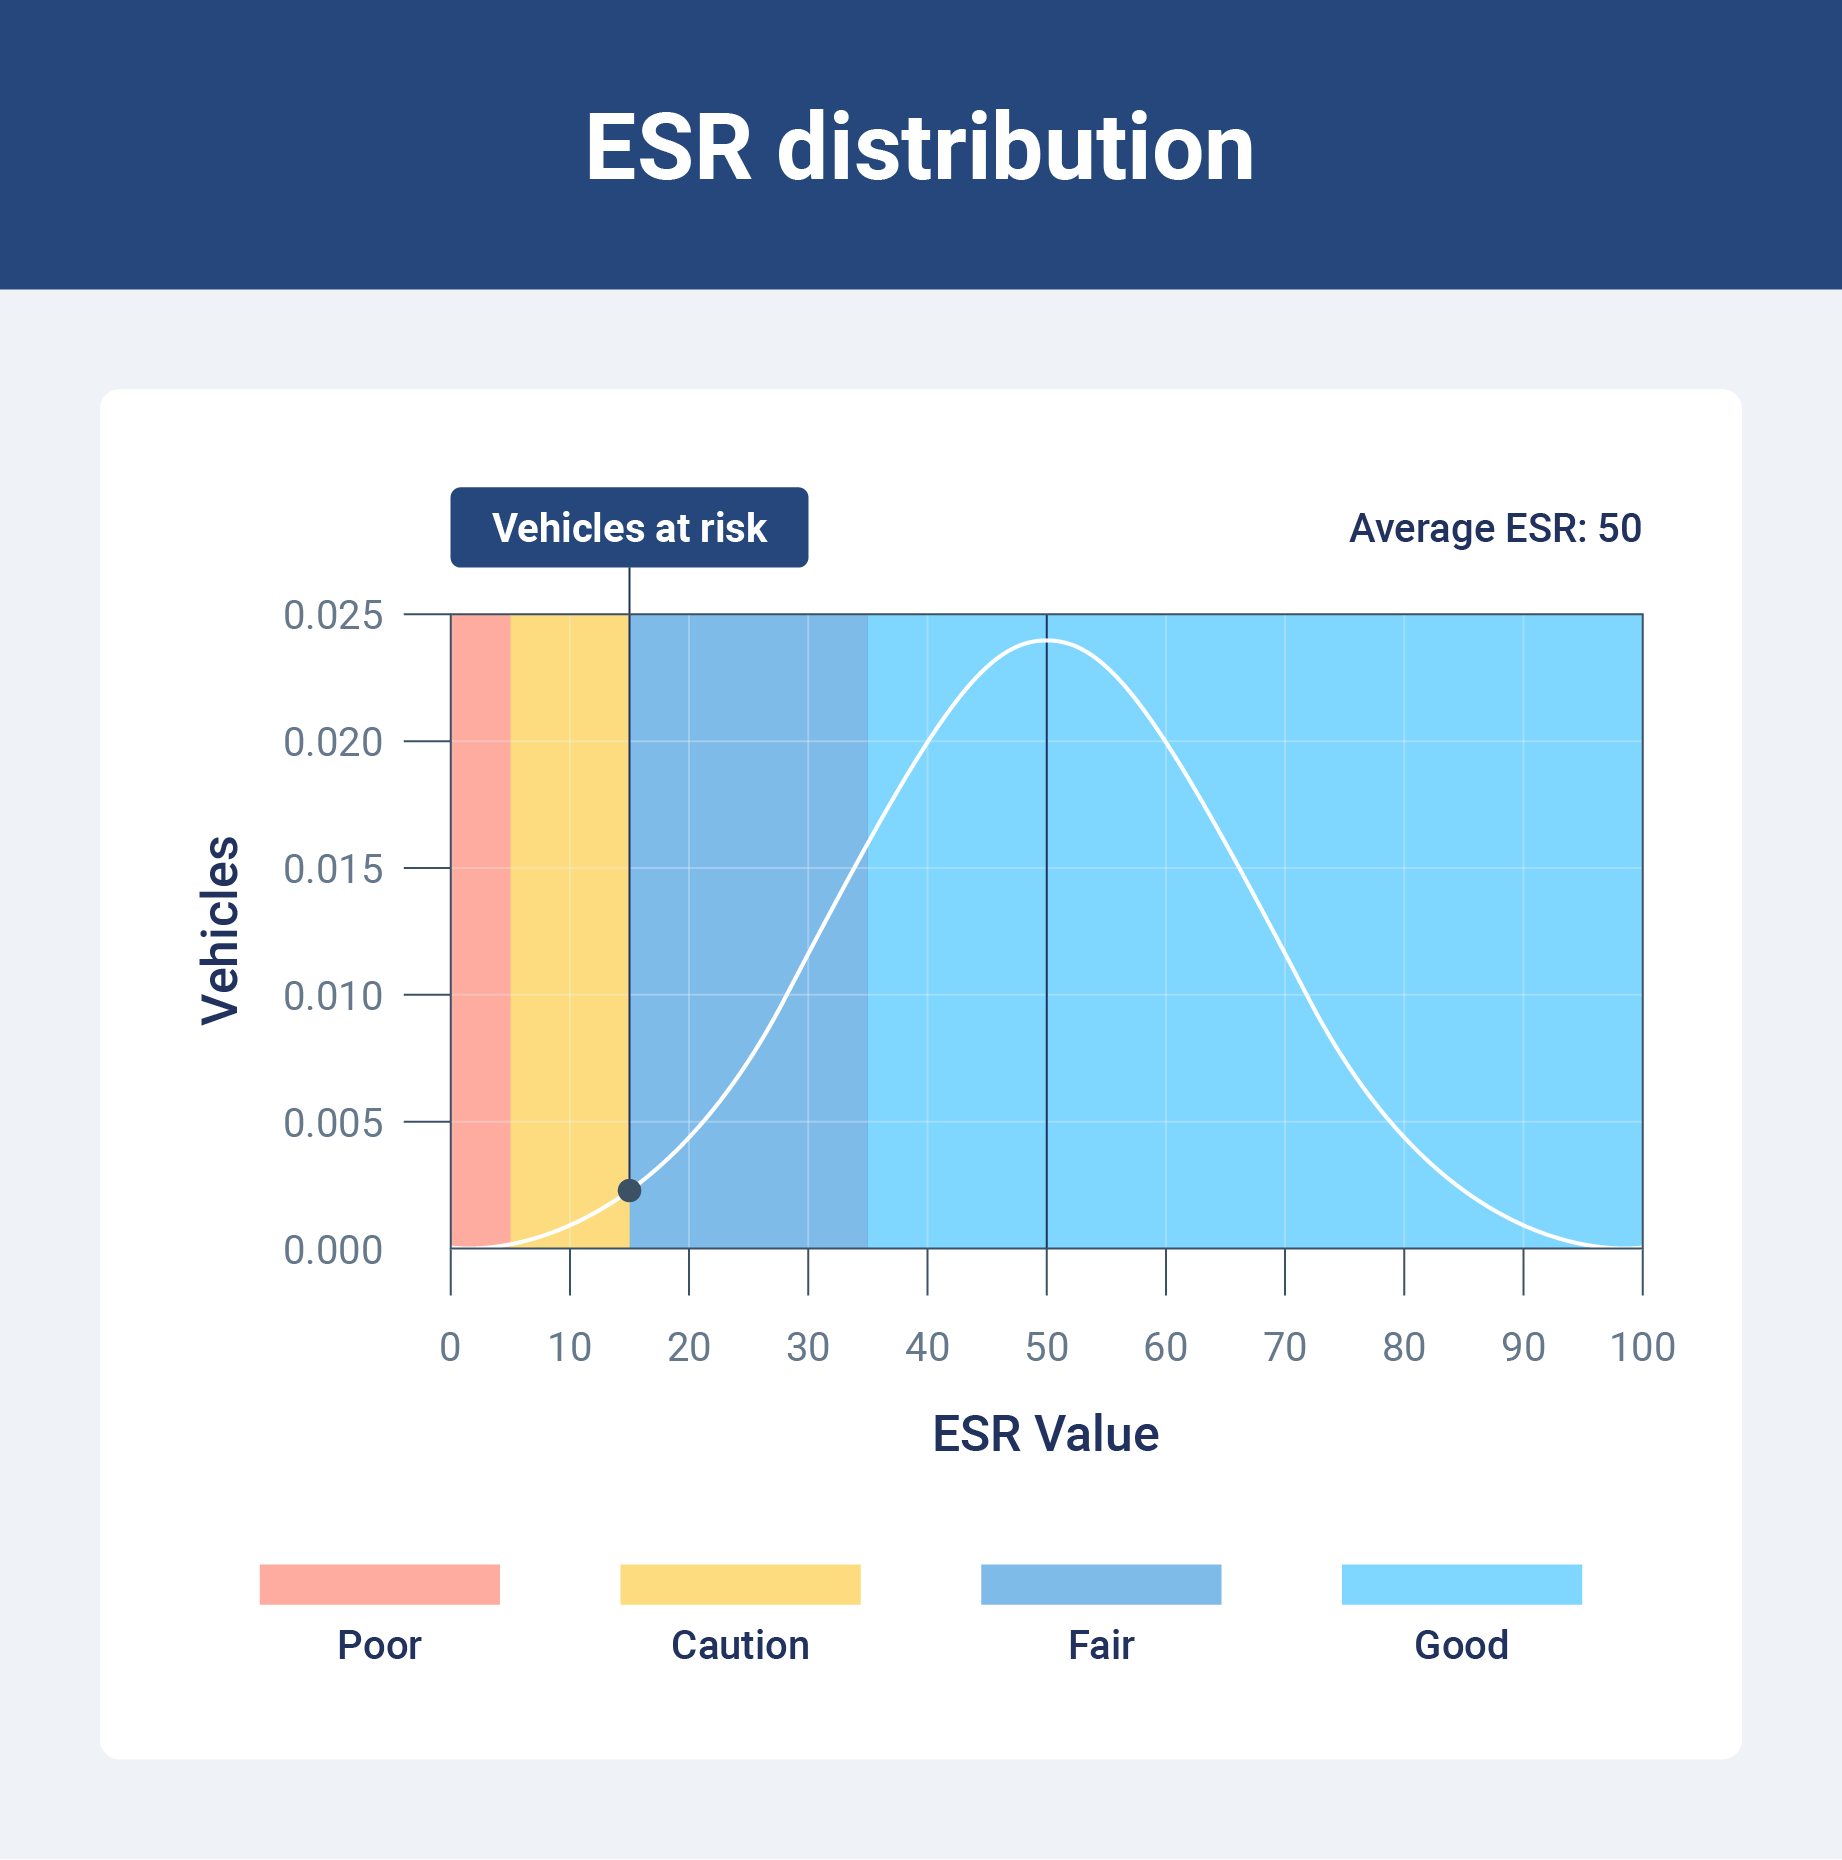
Reduce EV breakdowns and reduce cost and waste
Check out Geotab’s new Electrical Systems Rating (ESR) Report to determine your fleet’s battery health. Prevent on-road breakdowns while decreasing your unscheduled repairs ratio. The Electrical System Rating or ESR is a rating that measures the health of a vehicle’s electrical system on a scale from 0 to 100.
3. Fuel consumption and idling costs
Tracking fuel consumption and idling costs is an effective way to understand how fuel dollars are being spent across your fleet. Monitoring fuel usage trends can help you identify inefficiencies and adjust routes or driver behavior to improve overall fleet fuel efficiency.
MyGeotab offers a simple and efficient way to track this behavior and related costs, something that can be difficult to regulate manually. Frequent idling not only increases fuel expenses but also raises your fleet’s carbon footprint, adds labor hours, and contributes to higher maintenance costs.
The Geotab idling report is one of the many productive reports available to help improve fleet efficiency by hitting your target of 5% or less idling per vehicle.
4. Warranty recovery rate
The warranty recovery rate tracks how effectively your fleet recoups costs from manufacturer warranties on repairs or defective parts. The formula looks like:
Warranty Recovery Rate (%) = (Amount Recovered from Warranty / Total Eligible Warranty Costs) × 100
A higher rate lowers maintenance costs and reveals recurring issues, helping managers make informed decisions about vehicles, vendors and maintenance. Telematics data ensures claims are documented and submitted on time, keeping vehicles on the road and reducing downtime.
Vehicle and asset utilization KPIs
Vehicle and asset utilization KPIs help fleet managers track how effectively their vehicles and equipment are being used. Monitoring metrics such as vehicle downtime, repeat repair frequency, and overall fleet asset utilization highlights underused assets and supports smarter fleet planning and improved cost efficiency.
5. Fleet asset utilization rate
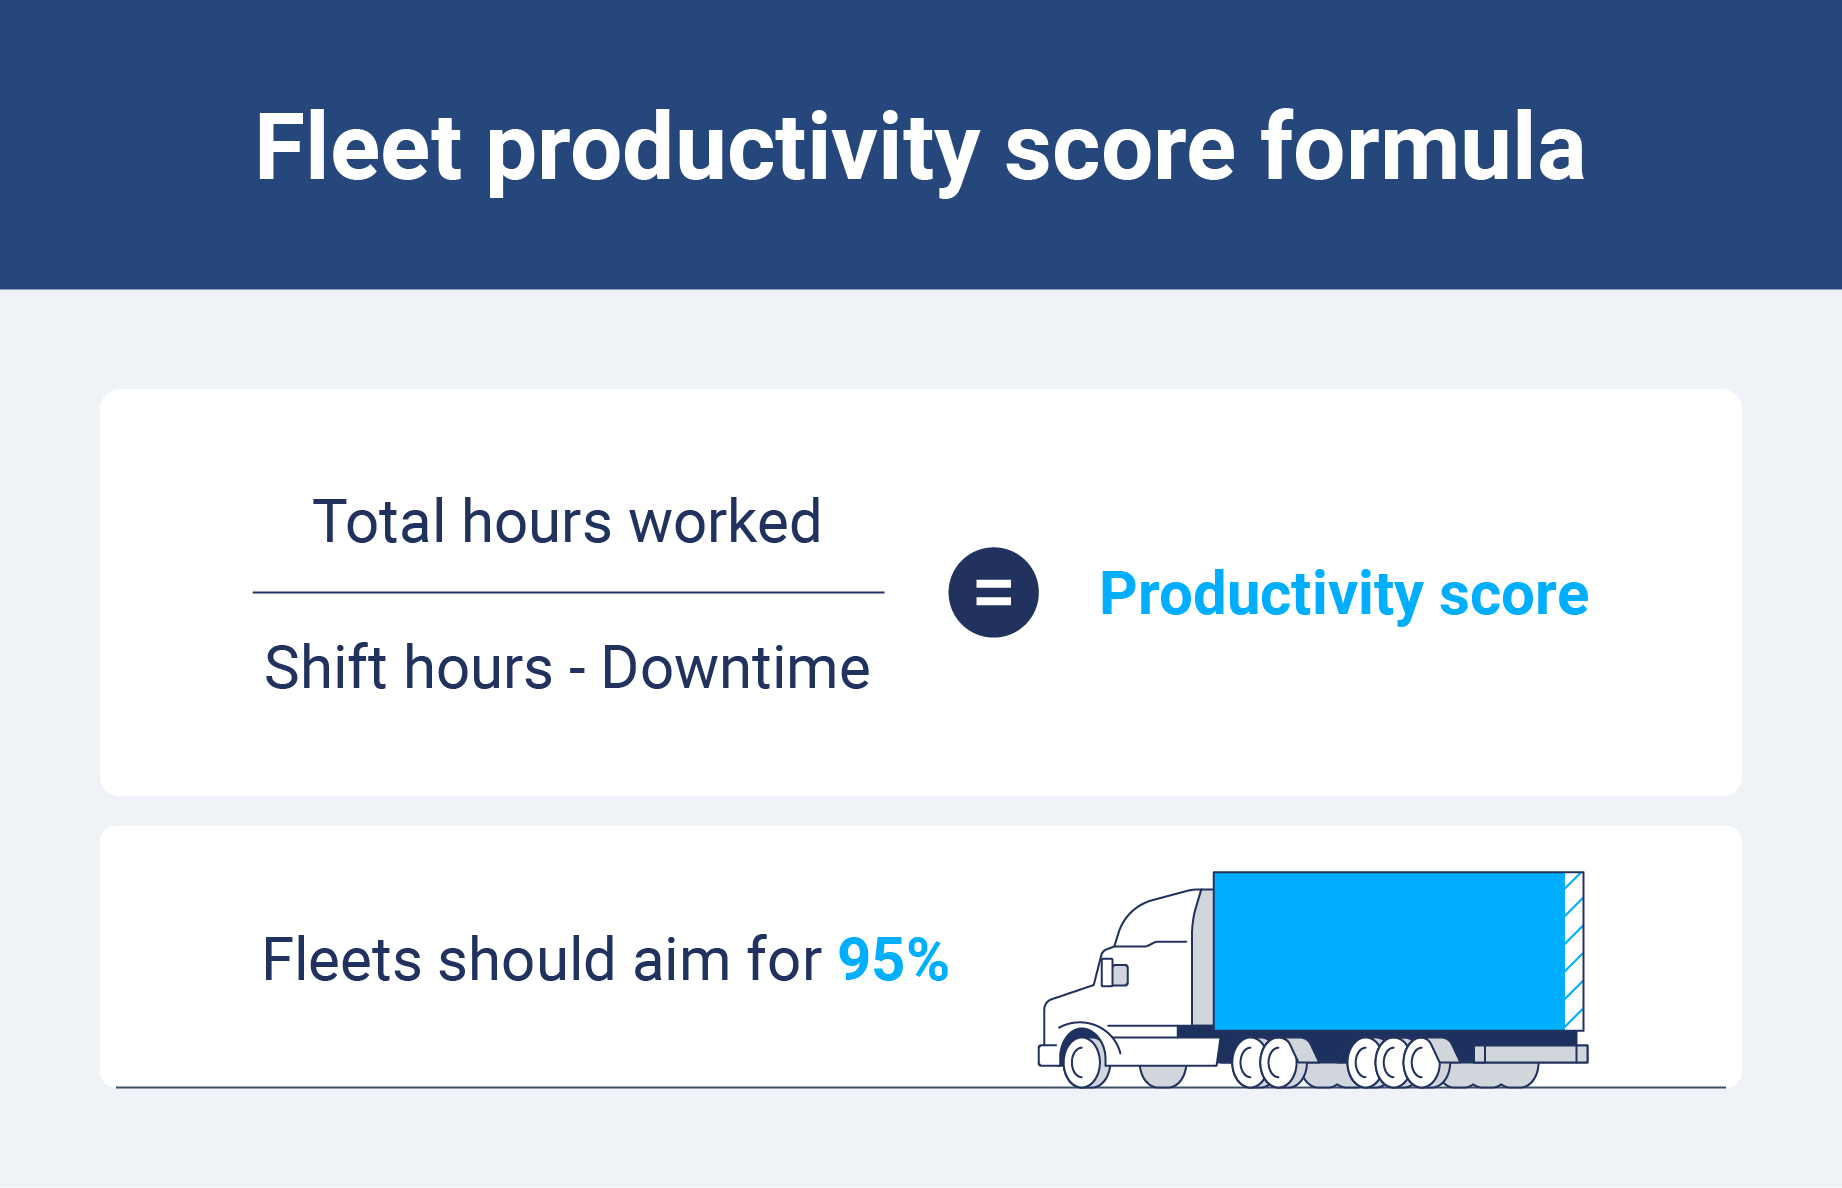
Setting ambitious goals for fleet asset utilization and minimizing downtime sets you on a strong path to success. Especially if your fleet vehicles are in top mechanical health. For this metric, aim for a rate of 95%.
To calculate your fleet productivity, use this formula:
Productivity Score = Total Hours Worked / (Shift Hours minus Lunch, Breaks, Meetings and Downtime such as Traffic)
To maintain an optimal active on-the-road operation rate, check your vehicle status daily. Doing so allows you to take proactive actions to maximize utilization. Reviewing this score in the morning helps you plan the day efficiently and keep your fleet running at peak performance.
You can use this checklist to stay on top of tasks associated with fleet productivity and ensure vehicles remain active and efficient.
6. Downtime and maintenance completion rate
This metric measures how long it takes to get a vehicle in and out of your shop. Tracking maintenance completion times helps you assess the impact of future repairs on your fleet and plan accordingly.
To set realistic expectations, evaluate maintenance downtime by class. For example, specialty trucks versus regular cars. Certain high-priority vehicles, such as patrol or emergency vehicles, also impact maintenance speed.
Ideally, aim to complete 90% of maintenance work within 48 hours. For vehicles with more complex repair needs, consider using certified dealer service centers to ensure timely and effective maintenance.
7. Repeat repairs percentage
Are you noticing repeat repairs on the same vehicles at fleet service centers? Monitor how often the same vehicles return for the same issues. Aim for under 3% repeat repairs.
If you have a higher number, find out why by checking for vehicle recalls, or talking to technicians about the parts and techniques they are using.
8. Parts availability
If possible, consider using external vendors to manage your parts inventory. Maintaining in-house inventory can be costly, and unused parts may become obsolete.
Outsourcing increases your parts availability and is a smart financial move. Third-party companies can store and distribute parts for you, giving you quicker access to additional inventory without the cost of holding it yourself.
The ideal metrics for parts availability are:
- 80% of parts in stock immediately
- 90% available within 2 hours
- 98% available within 1 day
Driver performance and safety KPIs
Driver performance and safety KPIs track how well drivers follow safe practices and company policies. Monitoring metrics like driver behavior and compliance helps fleet managers improve behavior, reduce accidents and align with your fleet safety program.
Telematics data supports real-time insights to coach drivers and optimize performance.
9. Driver behavior metrics
Using driver behavior monitoring helps identify risky habits so fleet managers can provide safety training before accidents occur. This includes behaviors such as harsh braking, speeding and sharp turns. Preventing these incidents saves money, protects drivers and reduces maintenance downtime.
10. Customer and employee satisfaction
To keep your fleet running smoothly, actively monitor your customer satisfaction rate using tools like online or phone surveys. Regularly gathering feedback helps you quickly identify and resolve issues, ensuring service quality remains high.
Aim for a 90% customer satisfaction goal to maintain strong relationships with customers. The same approach applies to driver and employee satisfaction, which directly impacts productivity, retention and overall fleet performance.
11. Compliance KPIs
Maintaining compliance helps prevent fines and ensures your vehicles and drivers stay on the road without interruptions. Monitoring these metrics allows fleet managers to address issues quickly and simplify the overall compliance process.
Key metrics include Driver Vehicle Inspection Report (DVIR) completion, which ensures vehicles are checked for safety before use. Electronic Logging Device (ELD) hours-of-service compliance ensures drivers stay within legal driving limits.

Operational efficiency and productivity KPIs
Operational efficiency and productivity KPIs help fleet managers track how well vehicles, maintenance teams and processes are performing. Monitoring metrics like preventive maintenance and inventory turns improves fleet management efficiency and reduces downtime.
12. Preventive maintenance frequency
Scheduling and completing vehicle maintenance requirements on time is critical to maintaining your fleet safety and active operation levels. Telematics systems simplify this by detecting mechanical issues through engine fault codes and sensor data, often before a driver notices a problem.
Preventive maintenance records are also essential for compliance, including duty-of-care requirements. Implementing formal vehicle maintenance and safety policies provides clarity about when to schedule oil changes, tune-ups, brake service and tire replacements.
Predictive maintenance helps reduce vehicle wear and tear, and it decreases the likelihood of breakdowns and major repairs.
Fleet managers can support efficiency by establishing policies and standards that:
- Require service with manufacturer-approved parts at specified locations to maintain warranties and prevent mechanical failure.
- Formalize payment methods, pricing authorization and emergency reimbursement policies to empower employees and build trust.
- Specify maintenance schedules based on time, mileage or both, helping drivers plan and minimize disruption.
Knowledge of fleet maintenance policies should be refreshed frequently. Clearly outline processes and keep documents up-to-date to encourage compliance.
13. Technician productivity and efficiency
To understand the productivity and efficiency of your maintenance operations, ask yourself these questions:
- Are your maintenance and repair costs assigned to multiple departmental cost centers?
- What are your current trends related to billable productive hours, considering sick time and paid time off?
The ideal productivity score is 70%. If productive times exceed that percentage, there may be something wrong with your calculations.
Technician efficiency (active working ratio) should be around 90%. It’s important to balance the size of your fleet maintenance team with the maintenance and repair needs of your vehicle and equipment inventory.
Staff your team with technicians that understand the modern heavy- or light-duty vehicle maintenance requirements and electronics.
14. Inventory turns
Inventory turns measure how effectively your fleet manages maintenance parts. You want enough on hand to keep vehicles running without overspending on unused stock.
Tracking this KPI helps fleet managers balance parts availability with cost efficiency, ensuring maintenance teams can access what they need when they need it. Combined with telematics, this KPI supports smarter planning, faster repairs and vehicles staying on the road longer.
How to set fleet KPIs the right way
Setting fleet KPIs the right way starts with SMART (specific, measurable, achievable, relevant and time-bound) goals. This framework helps fleet managers define actionable targets rather than vague objectives.
One example of a SMART goal for fleet managers is: “Reduce unscheduled maintenance events by 15% over the next 12 months by implementing predictive maintenance scheduling.”
It’s important to track KPIs consistently so your data is accurate. Monitoring metrics such as preventive maintenance compliance, fuel efficiency and driver behavior highlights inefficiencies and informs better decisions.
Using telematic software like Geotab provides real-time data to make your fleet maintenance tips actionable and keep operations running smoothly.
Simplify fleet maintenance and maximize uptime
Balancing your vehicles’ mechanical needs with your employee and customer satisfaction can be challenging. By establishing fleet goals and metrics to monitor your performance, your fleet managers can do their best work.
These metrics help keep your vehicles on the road and set standards for your drivers to adopt safe driving habits. Try following industry best practices by setting and tracking fleet efficiency goals and metrics that are SMART.
Start exploring your options. Visit our Marketplace maintenance and diagnostics solutions to help track your vehicles and improve your fleet maintenance management processes.

Subscribe to get industry tips and insights
Frequently Asked Questions
Fleet performance is measured using key performance indicators (KPIs) that track areas such as safety, fuel efficiency, vehicle utilization and maintenance. These metrics give fleet managers actionable insights into how well their operations are running and help identify areas for improvement.
Modern fleet management software makes this process even easier by automatically collecting and analyzing performance data in real time.
Five examples of key performance indicators for fleet management are:
- Fuel efficiency
- Vehicle utilization
- Driver safety
- Cost-per-mile
- Maintenance
Cost per mile is calculated using this formula:
Cost Per Mile = Total Cost Of Ownership / Total Miles Driven
The total cost of ownership includes fixed costs (insurance, licenses, registration) and variable costs (fuel, tolls, mileage-based maintenance). This gives fleet managers a clear picture of how much each mile truly costs.
To reduce maintenance downtime, track KPIs for fleet management such as repair frequency, mean time to repair (MTTR), scheduled vs. unscheduled maintenance, vehicle utilization, preventive maintenance compliance and driver safety incidents.
Monitoring these metrics helps predict issues, prevent breakdowns and keep your fleet running efficiently.
The Geotab Team write about company news.
Table of Contents
Subscribe to get industry tips and insights
Related posts

Building a proactive government fleet safety program with data and AI
March 9, 2026
5 minute read

Building resilient school bus operations through four student transportation trends
February 24, 2026
6 minute read

Telematics trends for 2026: What is changing and how fleets can respond
January 30, 2026
6 minute read
Fleet GPS tracking systems cost: Full price breakdown and ways to boost ROI
January 30, 2026
6 minute read


Fleet operations: Key components, benefits and challenges
January 7, 2026
4 minute read