Fleet safety analytics insights: Context matters when analyzing driving behavior
Geotab analyzes contextual risk to help fleet managers better understand the environmental factors that shape fleet safety beyond driver behavior and vehicle health.

By Jim Davis
Mar 27, 2025

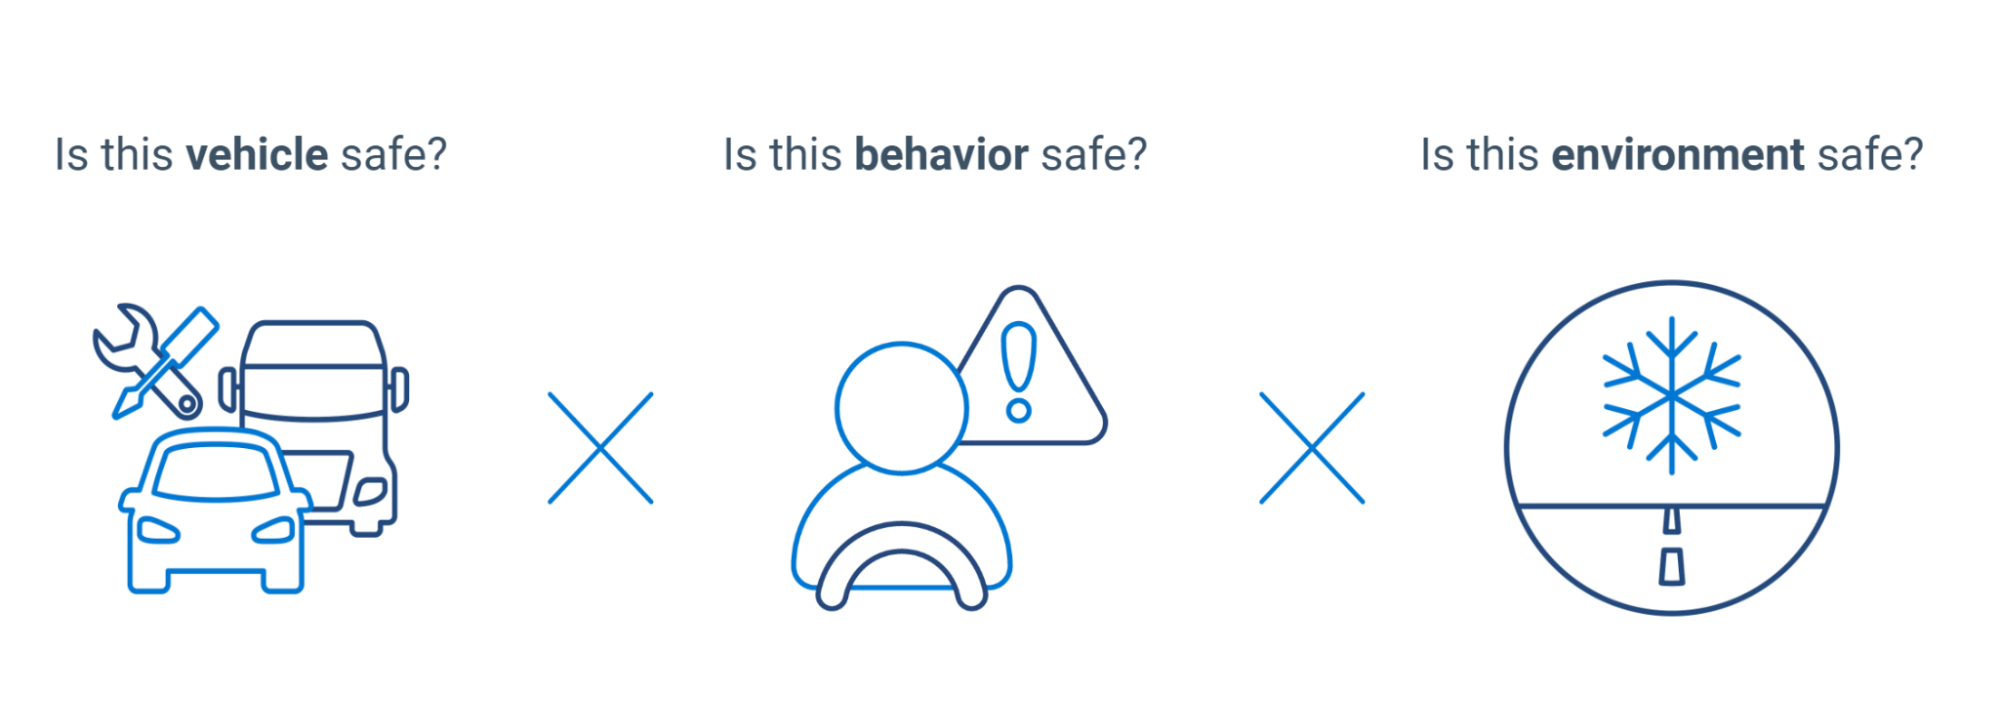
Traditionally, fleet managers have relied on measuring the ABC’S (acceleration, braking, cornering and speeding) of driving to judge driver behavior with the hope of improving fleet safety. However, without knowing why a driver reacted in a certain way, data remains simply data and can not be acted upon. For example, harsh turning maneuvers to avoid potholes would typically be viewed as safe. while driving at the speed limit on a snowy day in Toronto would be considered unsafe. These scenarios show why taking context into account is critical when evaluating comprehensive fleet safety.
Fleet safety insights: A contextual approach
At Geotab, we view safety-related context as a combination of three factors: vehicle safety (roadworthiness), driver behavior and environmental conditions.
Key considerations for fleet and insurers:
- Most risk managers & insurers desire a means of boiling down all of the safety exposures (vehicle integrity, driver actions, environment) into easy-to-understand analytics dashboards(e.g., driver score).
- Fleet managers need predictive insights about their vehicles: actionable, data-rich reports that are applicable and specific to segments of fleet operations, not a cumulative score for both heavy-duty trucks (HDT) and private passenger type (PPT) vehicles). These insights provide drivers with the opportunity to improve their driving habits with clear, irrefutable feedback on how to improve)
- For fleet managers context matters. You can’t change when and where you operate your business — but it helps to be aware of pertinent environmental risk factors.
- For insurers, this means environmental factors that are different for every intersection, ZIP code, state, and North American Industry Classification System (NAICS) codes of their insureds.
These characteristics should all be measured within the same fleet, and benchmarked against other similar fleets. They should also be compared with historical performance for the same driver, as day-to-day performance can be impacted by many factors.
Fleet safety example scenario
Joan and John look like similar drivers. They both drive just over five miles, have two hard braking events and one hard acceleration event.
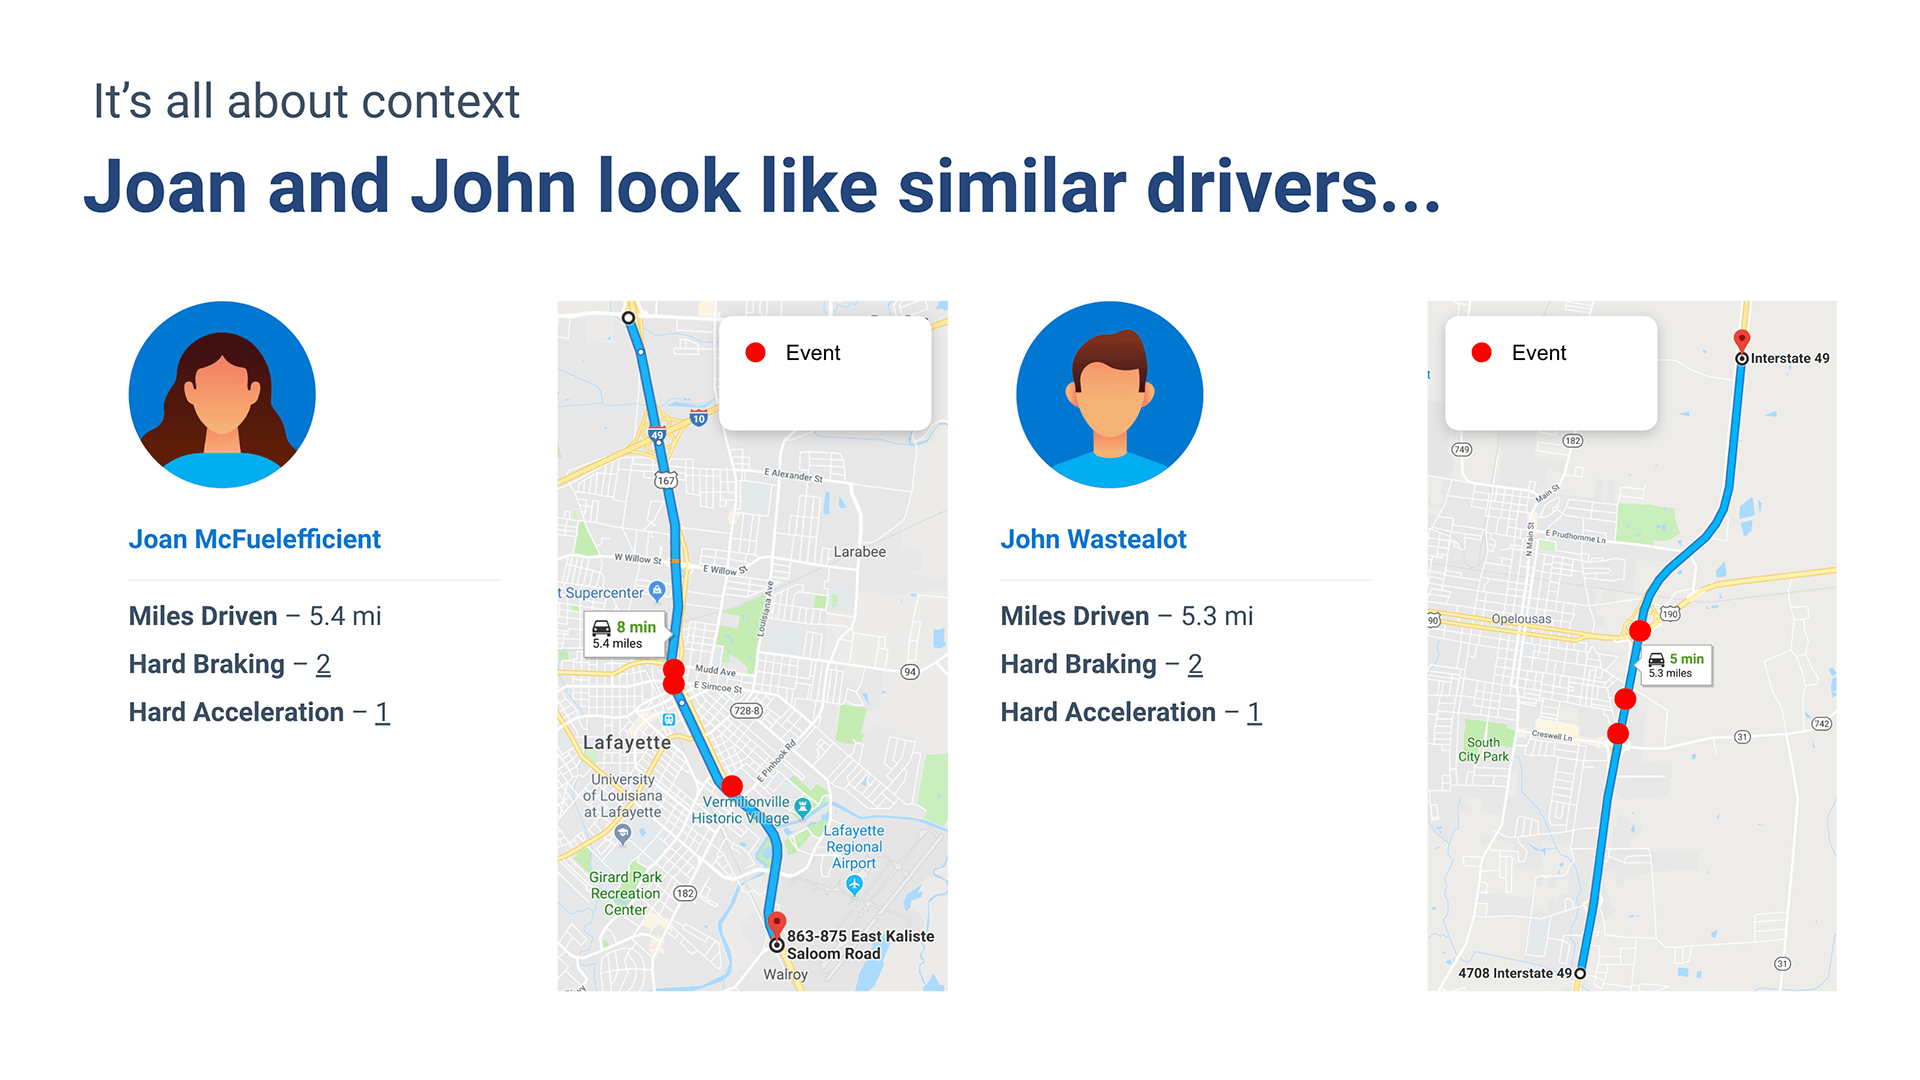
But look at how different their routes are. On her route, Joan drives through three hazard area events, while John drives through no hazardous areas.
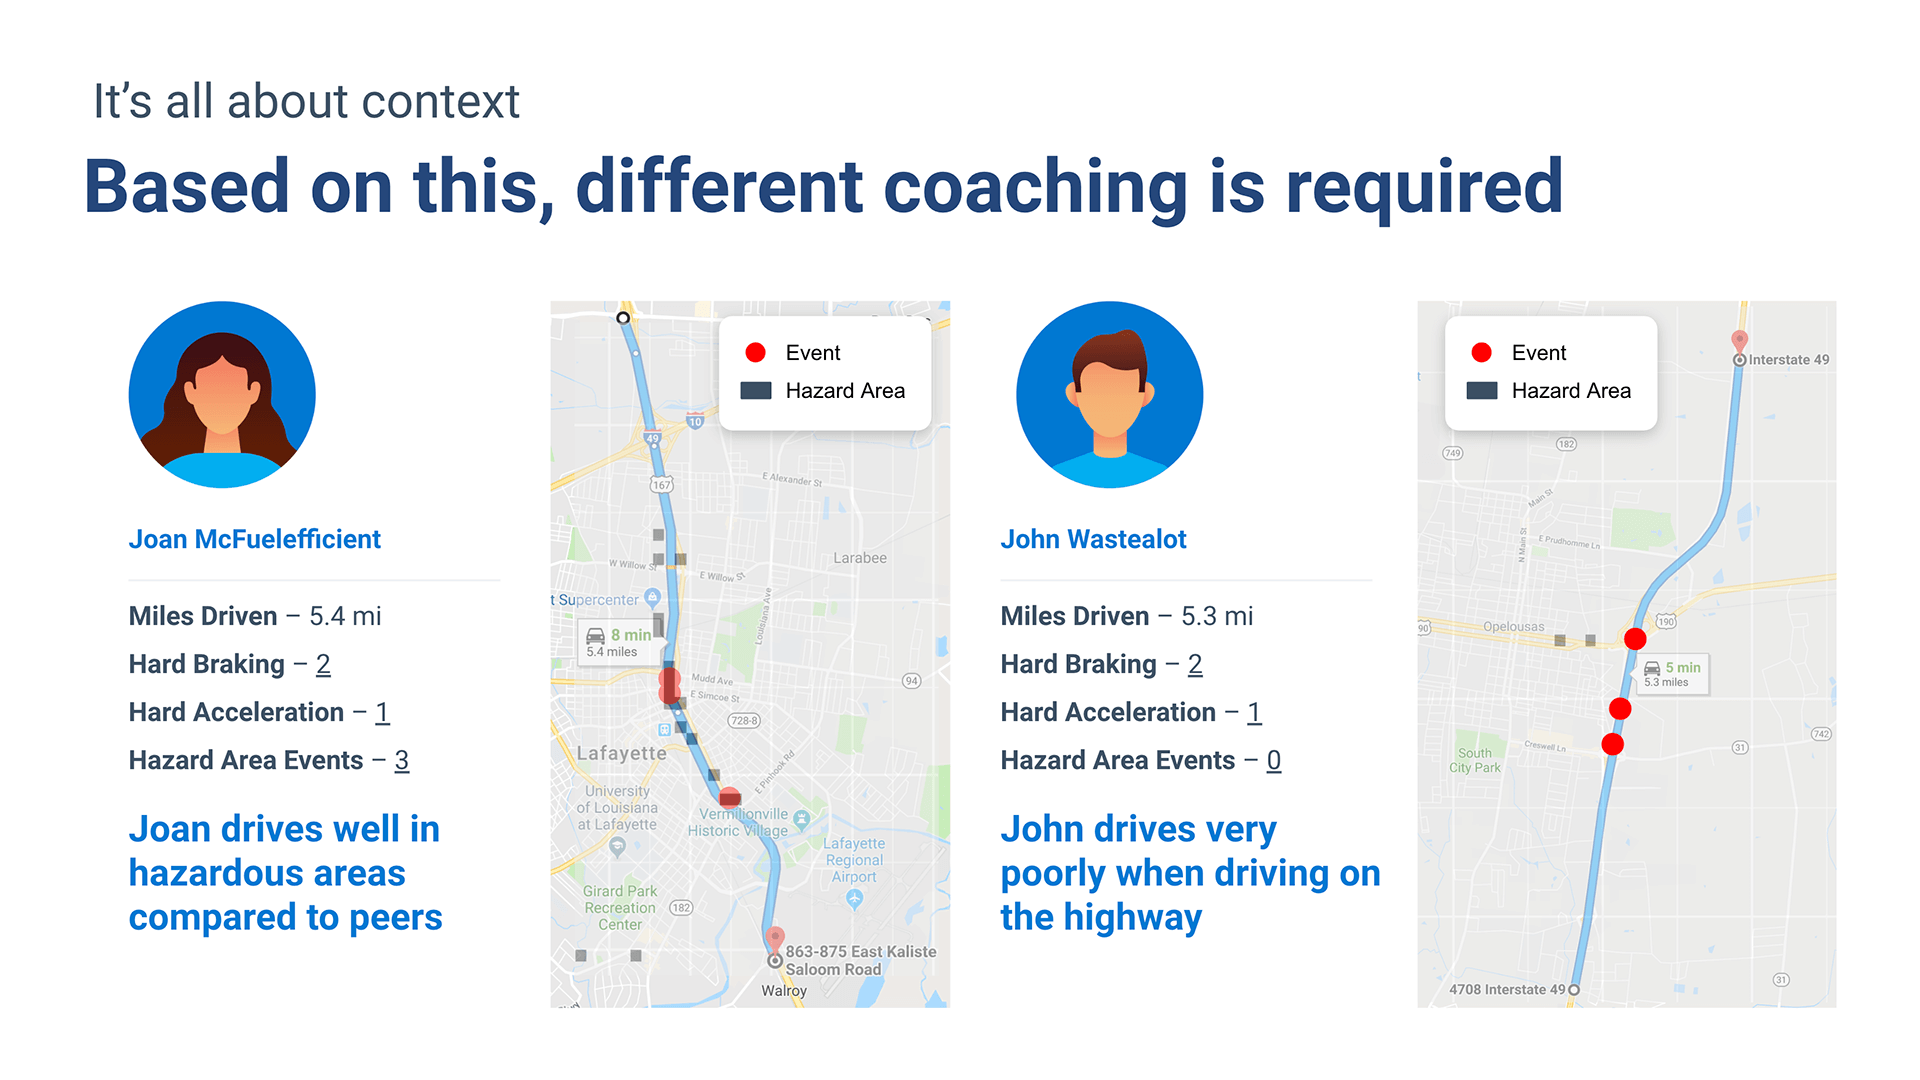
Based on this, different driver coaching is required. Joan drives well in hazardous areas compared to peers.
John drives very poorly when driving on the highway.
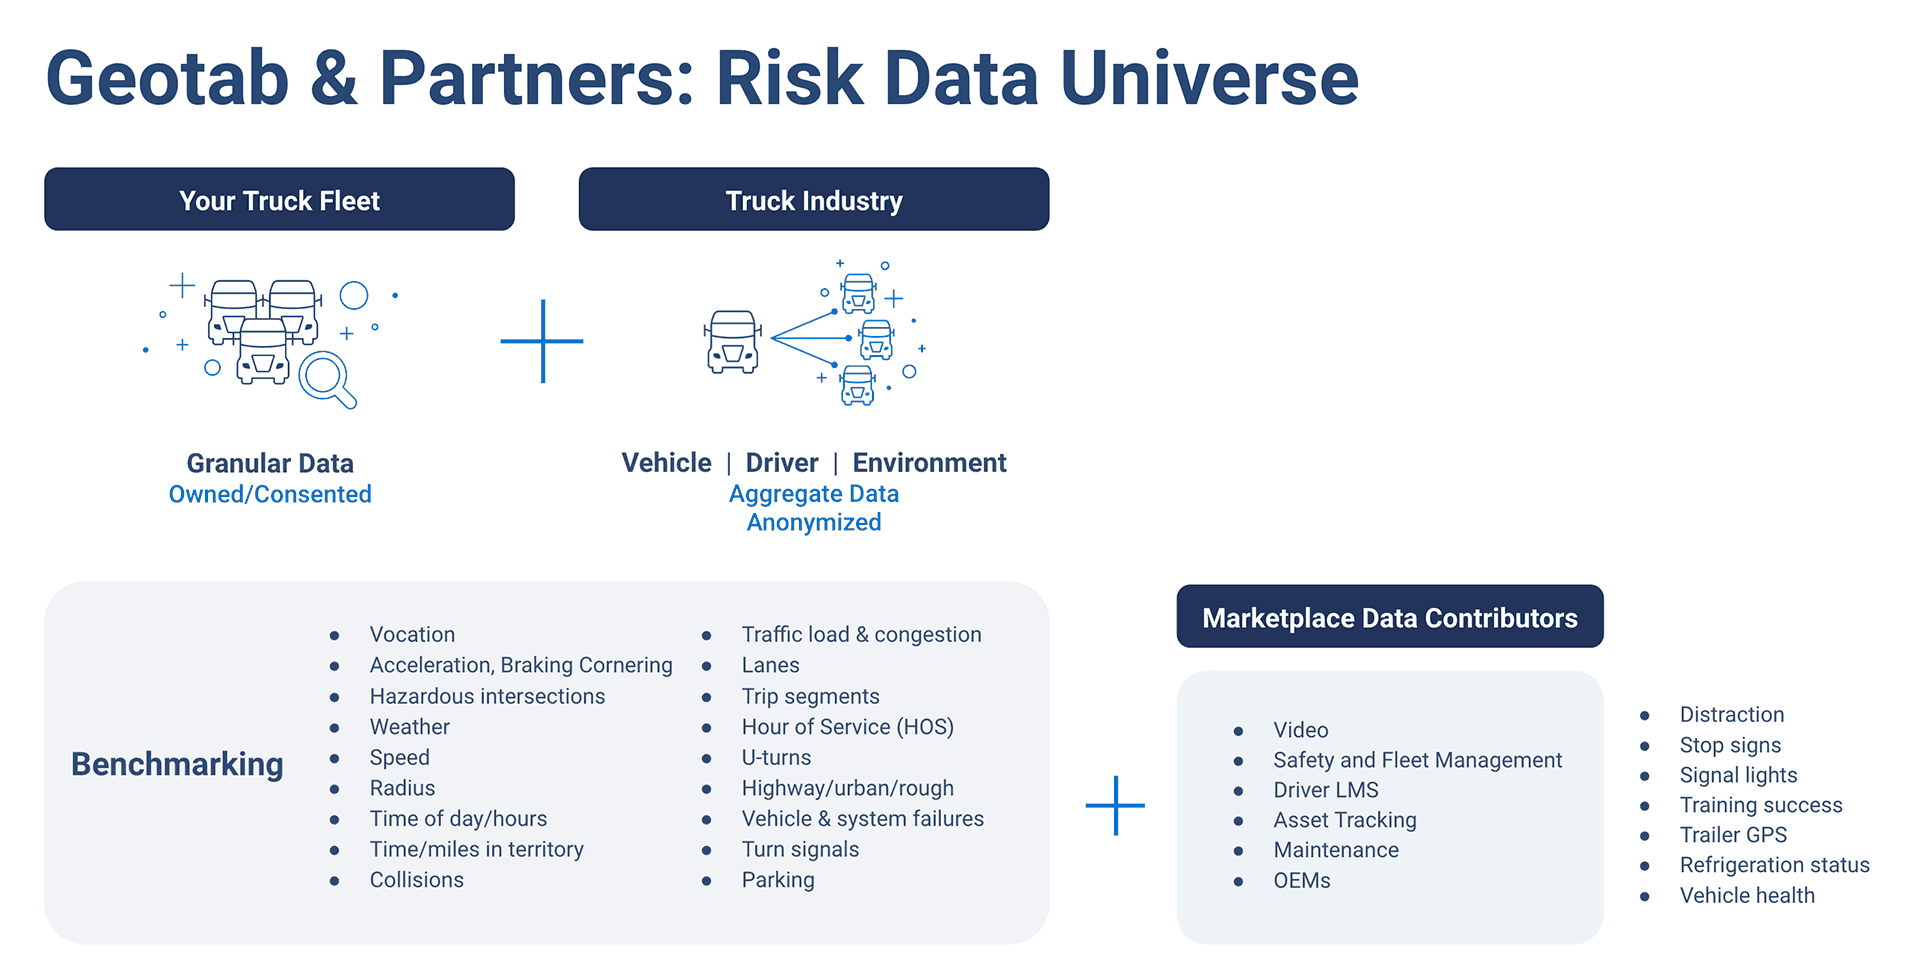
Safety benchmarking using machine learning
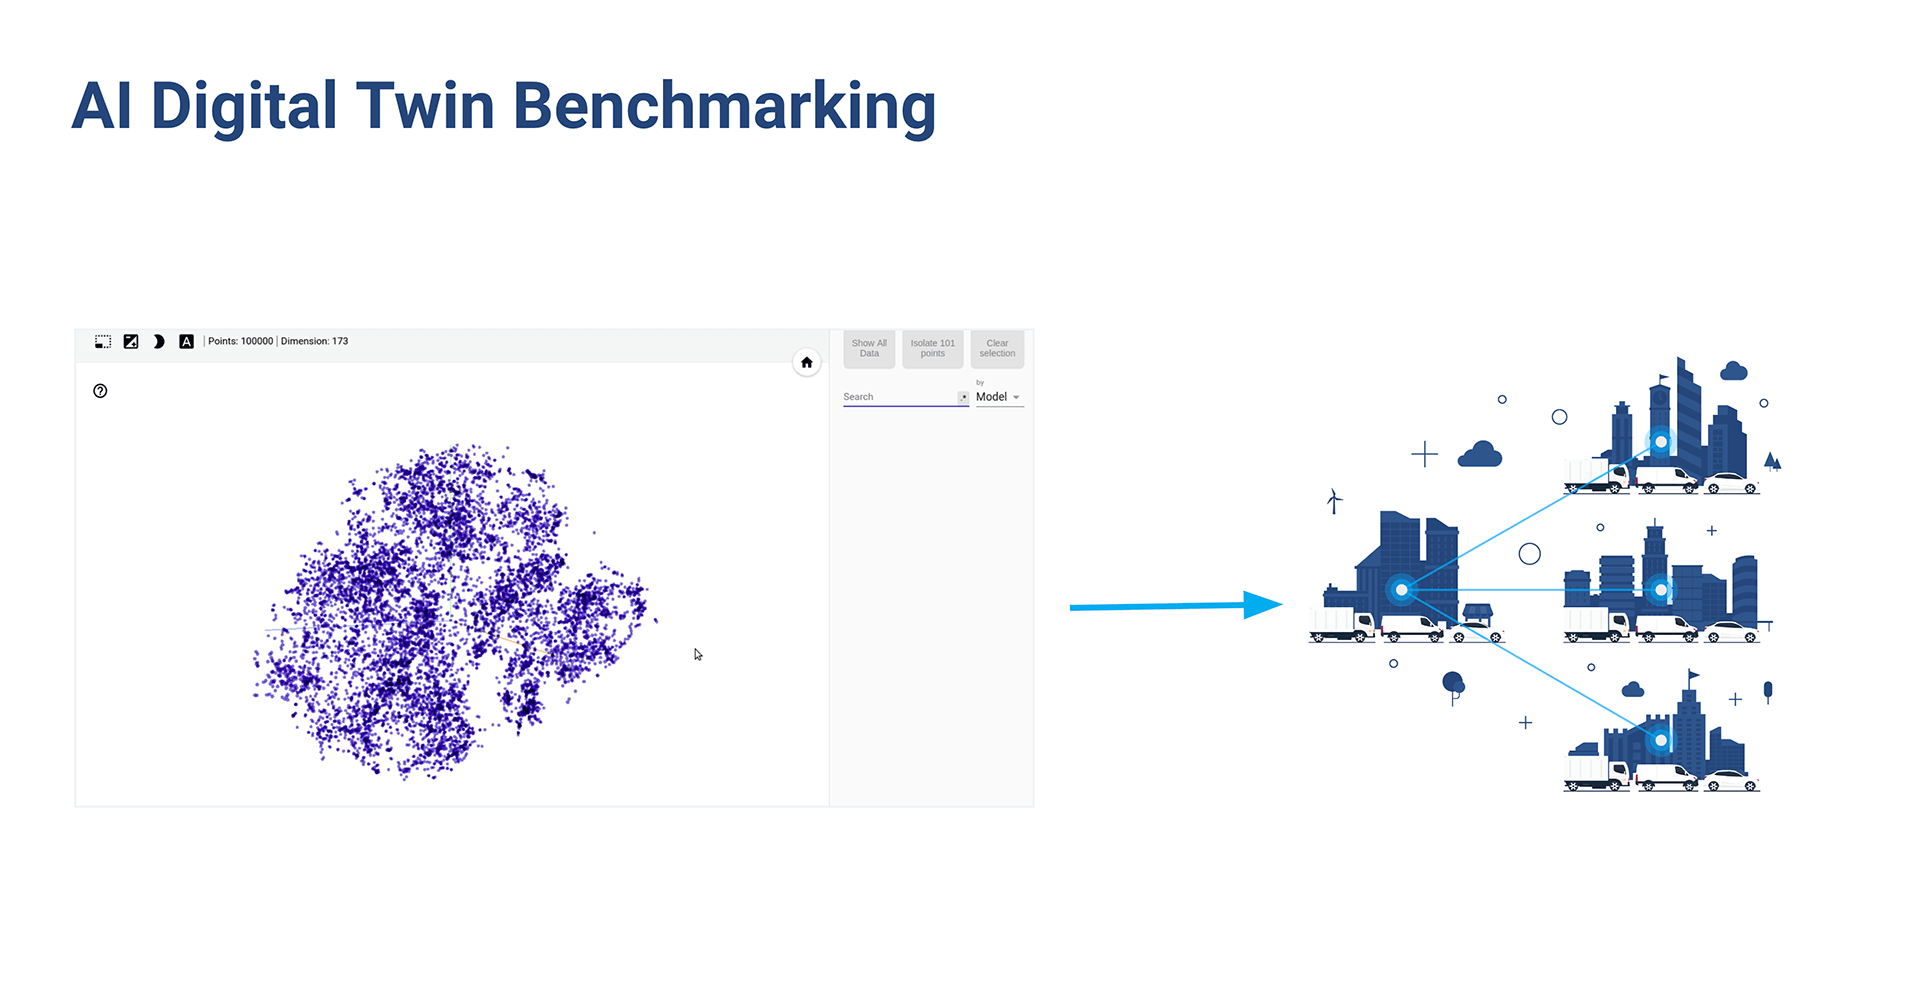
Geotab leverages the power of machine learning (ML) by applying it to telematics data from over 2.9 million connected vehicles. We can benchmark vehicles in individual fleets against hundreds or thousands of comparable vehicles so effectively finding their “twins” in the Geotab client base. We like to think of this as finding a ‘DigiTwin’ for each vehicle. An example of this functionality is the work of identifying each vehicle’s vocation. This approach has also allowed us to benchmark safety at the vehicle and fleet level in the Geotab Analytics Lab.
Contextual Risk Index: Contextual Safety Meets Machine Learning
To combine the power of context with the power of benchmarking, Geotab has also launched the Contextual Risk Index (CRI) to measure the predictive value of the three factors we mentioned above (roadworthiness, driver behavior and environmental conditions) taking a minimum viable product (MVP) approach to data validation. More details are below:
Geotab partners with TNEDICCA to study the connection between dangerous locations and risk
Case in point, Geotab partnered with traffic safety intelligence firm TNEDICCA on a pilot to explore the impact of dangerous locations on the risk signal perceived.
TNEDICCA’s mission is to reduce future traffic crashes through the better use of data and analytics. They built the most comprehensive crash location database of more than 30 million crashes, covering 94% of the U.S. auto insurance market. The company provides solutions to the auto insurance, navigation service, automotive manufacturing, and transportation planning industries.
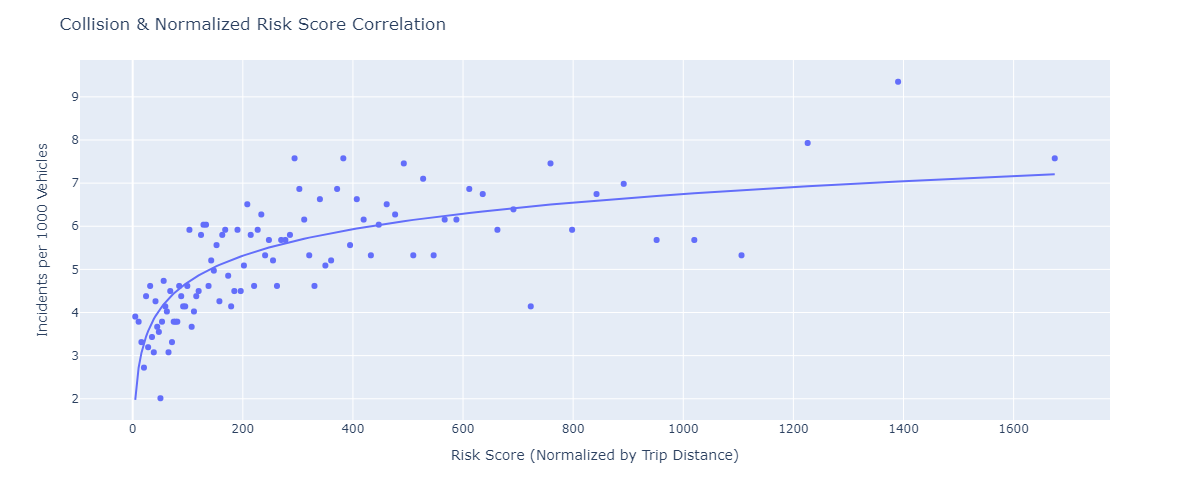
For Geotab’s analysis, we looked into over 600 million trips across over 800 thousand of our vehicles. When we analyzed our vehicle movement patterns against the risk scores mapped out by TNEDICCA, we found clear and positive correlations. Vehicles that travel through inherently riskier geographical locations are susceptible to higher collision risk.
For our analysis, we adjusted the risk scores by removing the impact of vehicle total mileage — so that we can isolate just the risk associated with traveling through collision-prone locations. In other words, if your vehicles constantly travel through collision-prone locations, they are more likely to be involved in a collision as well.
Discover new safety insights through the power of Why
We encourage our customers and partners to try out our safety experiments in Active Insights in MyGeotab and the Analytics Lab. Look for the Contextual Risk Index API in the Geotab API Explorer.
Subscribe to get industry tips and insights
Jim Davis is the Vice President, Insurance at GEOTAB
Table of Contents
- Fleet safety insights: A contextual approach
- Fleet safety example scenario
- Safety benchmarking using machine learning
- Contextual Risk Index: Contextual Safety Meets Machine Learning
- Geotab partners with TNEDICCA to study the connection between dangerous locations and risk
- Discover new safety insights through the power of Why
Subscribe to get industry tips and insights
Related posts

Construction fleet management software: What mixed fleets should look for
July 29, 2026
5 minute read

From video archives to active prevention: The case for AI dash cams
July 22, 2026
4 minute read

Best small fleet management software providers and how to choose one for your business
July 16, 2026
8 minute read