Polar vortex halts fleet activity in U.S.
See a timelapse showing how the polar vortex is impacting commercial fleet activity in Chicago, based on a Geotab analysis of connected vehicle data.

By Daniel Lewis
Apr 24, 2023

The polar vortex brought record-breaking temperatures to Chicago on Wednesday, with air temperature dropping down as low as minus 23 F, and down to minus 49 F with the windchill in some areas. These frigid temperatures are a significant safety concern for pedestrians and drivers alike as frostbite can happen in just a few minutes to any exposed skin. If a driver becomes stuck or stranded, a simple breakdown can quickly become a dangerous situation, especially when combined with icy and slippery road conditions.
Courier and postal services announce service disruption in U.S.
The cold weather also has a significant economic impact. Many commercial fleets suspended their operations for part or all of the day to ensure driver safety. This week, United Parcel Service (UPS) issued service alerts for New York and the Midwest U.S., suspending pickup and delivery for the day due to severe weather. Another media outlet reported a service disruption at the UPS Worldport hub in Kentucky. As well, the U.S. Postal Service put a hold on delivery due to the cold.
Total miles driven drops by half in Chicago due to cold temperature
Chicago is being gripped by arctic temperatures and fleets are feeling the impact. Using aggregate data from Geotab-equipped vehicles, we can quantify the impact this weather had on activity from commercial vehicles operating in the city and see just how significant of an influencing factor the weather can be.
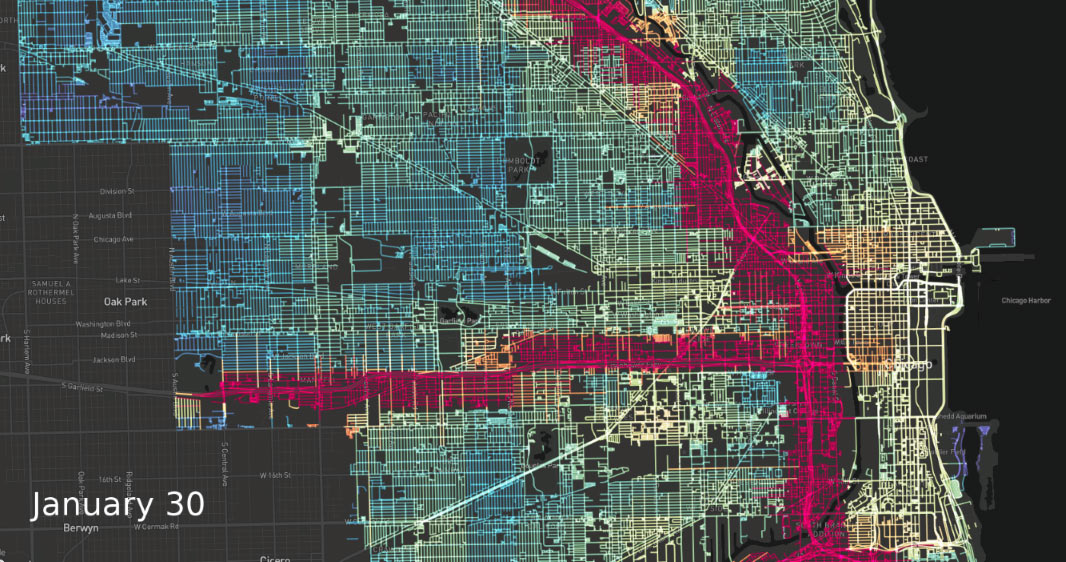
When we look at traffic on January 30, compared to last Wednesday, January 23, we see a remarkable 51 percent reduction in total miles driven by all fleets, according to the data. There is an overall drop in volume throughout the entire day, which translates into a drop in deliveries and other services in neighborhoods away from the main roads.
See also: Connected Cars Detect Mexico Earthquake
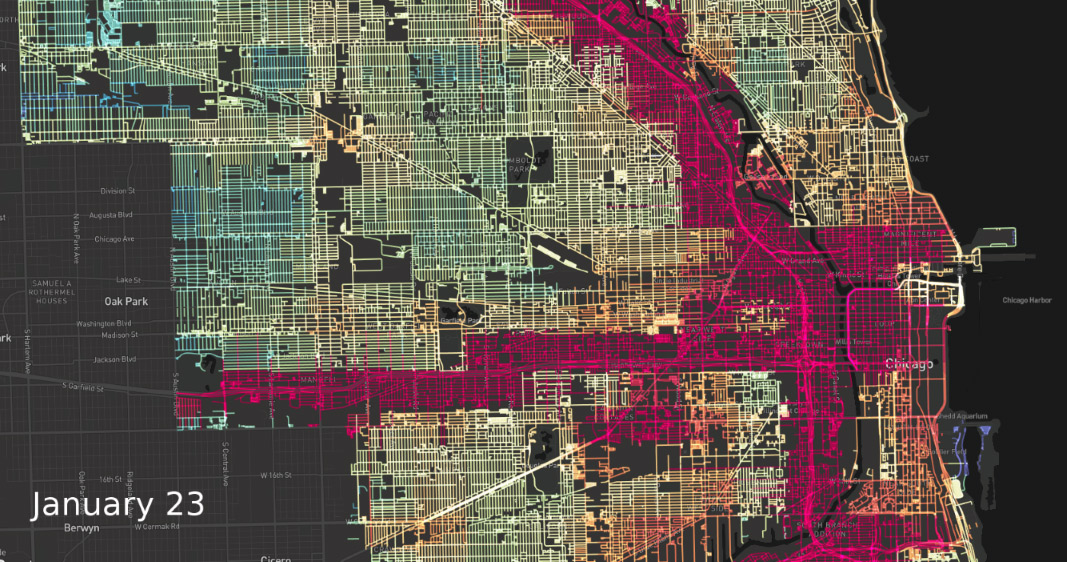
The images below show an aggregate view of downtown Chicago this Wednesday, compared with last week. In these heatmaps, the colors represent relative volumes of traffic. Red indicates the highest traffic volume and blue is the lowest.
We can readily observe the effect of the cold weather in a striking visual way.
January 23, 2019 — Commercial fleet activity in Chicago before polar vortex
January 30, 2019 — Reduced commercial fleet activity in Chicago during polar vortex
Below is an hour-by-hour display of traffic volume, grouped in a grid across Chicago, for the same two days. The color scale indicates the number of unique vehicles we observed making trips in that region of the city.
January 23, 2019 — Chicago commercial fleet activity (hour-by-hour)
January 30, 2019 — Chicago commercial fleet activity (hour-by-hour)
Connected vehicles offer insight into urban environment and beyond
Whether it’s hyper-local temperature or hazardous driving areas, connected vehicles can shed light on a number of different factors in an urban environment like Chicago, such as weather, road condition and driving patterns. The data insights can extend beyond the city too, wherever a vehicle drives and has cell or satellite service.
Geotab has a global network of over 1.4 million vehicles and processes more than 3 billion data points daily. Fleets and municipalities alike can use the intelligence and smart city datasets at data.geotab.com to help inform planning decisions and increase efficiency. Learn more at data.geotab.com
For Geotab news and fleet insights, subscribe to the Geotab newsletter.
Related:
Monitoring Road Icing with Hyper-Local Temperature Mapping
Geotab Analysis Shows Impact of Hurricane Harvey
Subscribe to get industry tips and insights
Daniel Lewis is a Senior Data Scientist, R&D Specialist for Geotab, working on predictive maintenance and smart cities projects.
Table of Contents
Subscribe to get industry tips and insights
Related posts
.jpg)
Marketplace Spotlight: Redefining Fleet Security with Matrix iQ
July 15, 2026
2 minute read
AI readiness checklist for field service fleets: Is your data ready for AI?
July 6, 2026
1 minute read

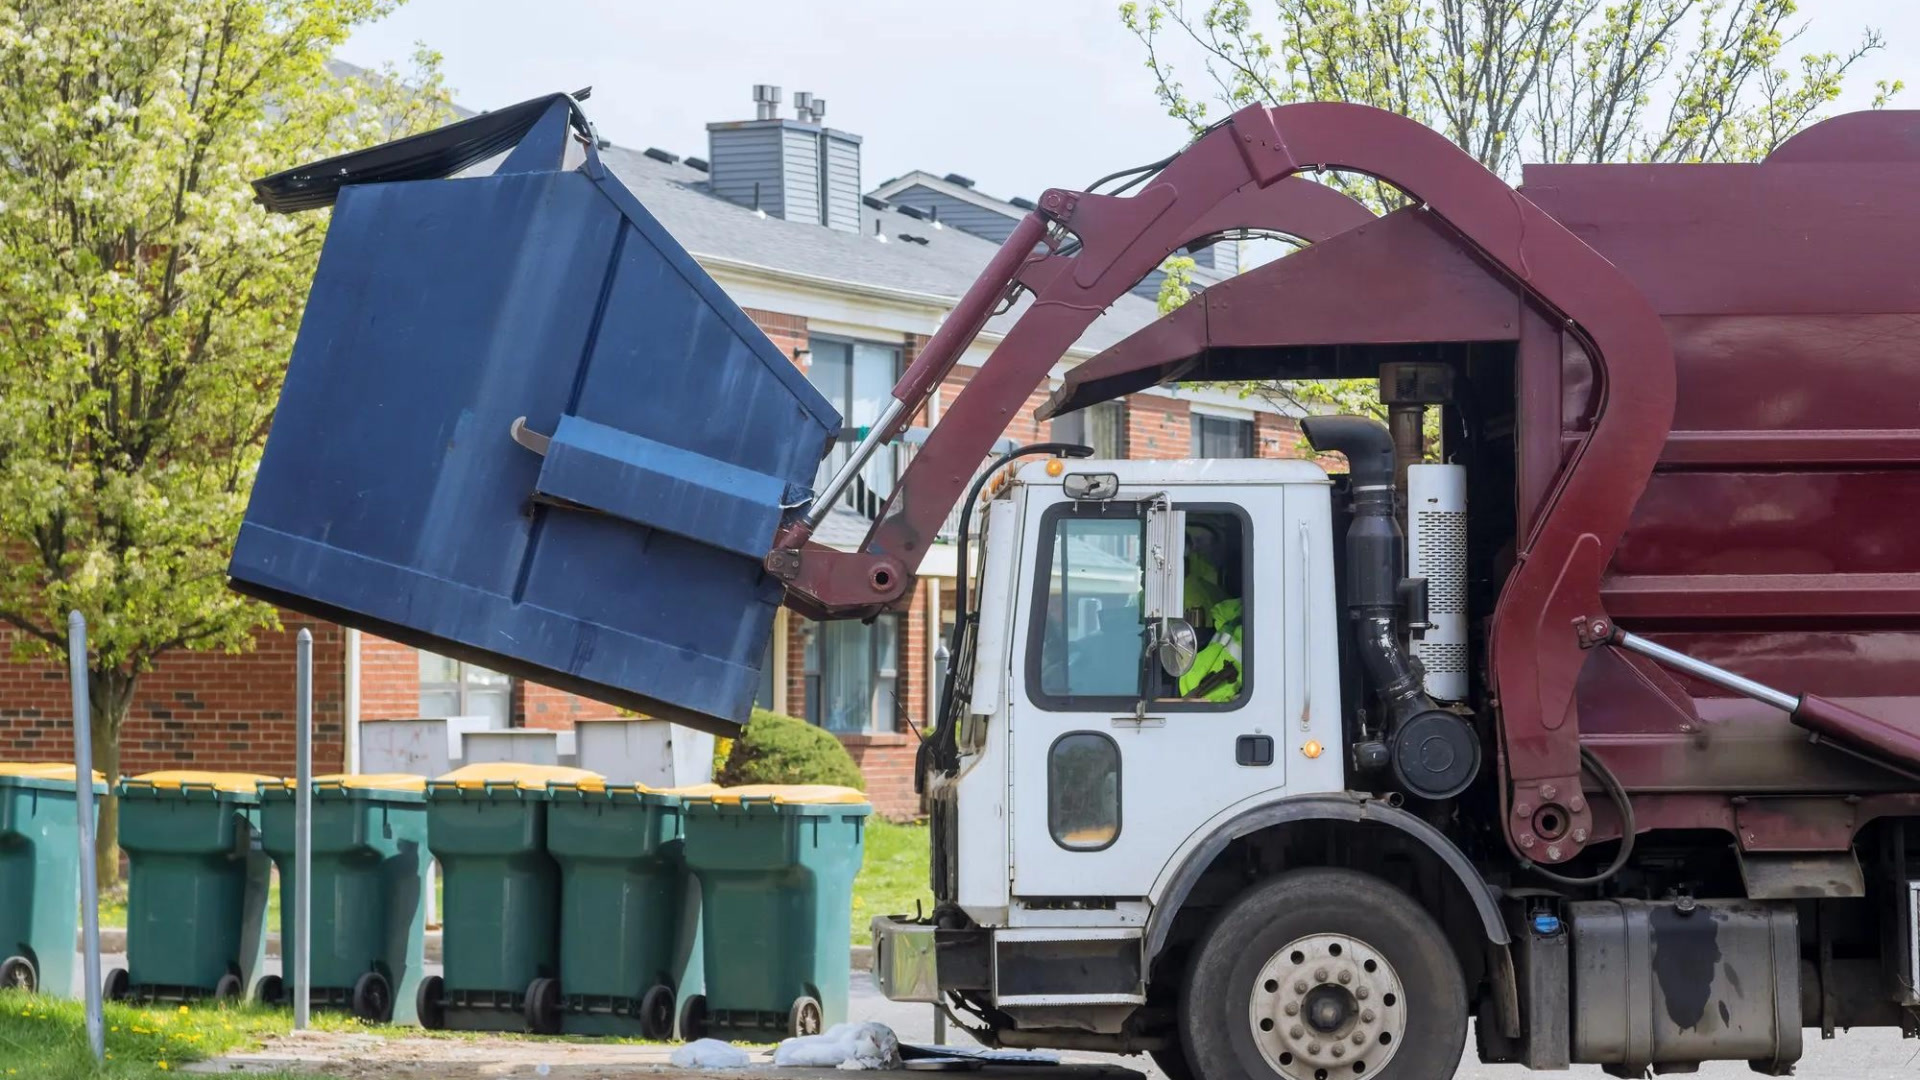
How sanitation fleets can prevent return trips and reduce solid waste collection costs
June 15, 2026
3 minute read
.png)
Elevating the Ecosystem: The BlueArrow Approach to Integrated Telematics
May 27, 2026
2 minute read

What astronauts and Axon Week taught me about public safety
May 21, 2026
4 minute read