
Putting fleet data quality to the test for risk management
Table of Contents
Executive summary
Data quality in telematics matters. Having accurate information can support critical fleet safety and risk management activities such as coaching drivers and reducing vehicle collisions.
To validate the quality of data that the Geotab® GO® device transmits, Mecanica Scientific Services Corp. (Mecanica) conducted a thorough testing experiment on a closed race track, using medium-duty panel trucks, GO devices and high-precision data loggers.
Based on the results, Mecanica found that the data from the GO device is comparable to that from the high-performance Racelogic VBOX 3iSL RTK, providing high-performance data detail and data quality and that the curve-based algorithm is most efficient.
This paper explores the experiment, the results, and provides follow-up analysis.
Delivery fleets face increased demand and disruption
Nowadays, fleets are facing pressures from all sides, costs continue to rise for vehicles, fuel and tires.1 Last-mile delivery fleets, in particular, are often confronted by service disruptions amidst rapid e-commerce growth.2 What’s more, the dramatic increase in online shopping brought on by the pandemic may become a permanent shopping behavior change globally. This trend was highlighted in a consumer survey by the United Nations Conference on Trade and Development (UNCTAD) and the Netcomm Suisse eCommerce Association.3
Despite increased demand and supply chain challenges, businesses must continue to satisfy increasing customer expectations. They must do so while fulfilling compliance requirements, controlling the budget, and meeting company safety goals.
The importance of data accuracy in fleet management
Any business decision is only as good as the data which influences it. Having accurate data means that managers and leaders can confidently take informed action, gain trust, and lower the risk of unexpected outcomes. When data is incorrect or missing, this impacts the business and the bottom line, gaining or losing a competitive edge. Time is lost in fixing errors or having to update plans.
Connected vehicle technology enables businesses to view and analyze their fleet data. With telematics, companies can track fleet metrics related to risk, vehicle location, and risk-related data such as collision rates, including speeding, harsh accelerating, braking and cornering, and failure to wear seat belts.4 OEM and aftermarket telematics devices, along with vigilance and attention to road safety, are vital ingredients to keeping fleets safer.5 Fleet managers can also leverage data to optimize their routes, avoiding traffic or construction zones.
The business impact of poor fleet data quality
Using technology that delivers a lower quality of data or misses data entirely can cast doubts on decision-making. By relying on inefficient methods of logging, fleets may miss out on important data needed for operations and safety management.
Possible negative outcomes of poor data quality in telematics:
- Inaccurate mileage
- Missing serious driving infractions
- Poor display on the vehicle map
- Logging redundant information
- Higher data costs
Putting telematics accuracy and effectiveness to the test
The quality of location and driving data is critical for route optimization, risk management, driver safety and keeping customers informed about their deliveries. To test Geotab’s telematics device accuracy, along with the curve logging data processing and analysis platforms they integrate with, Geotab and Mecanica Scientific Services Corp. (Mecanica) conducted a closed track test. A summary of the testing, the results, and the analysis begins on the next page.
In telematics, there are different methods of GPS logging: curve logging, time-based and distance-based data transmission. The time slice and distance methods limit recording. In these cases, fleet data analysts could miss critical events or information such as high or low values for speeding and cornering.
Geotab is put to the test on a 1.86 mile racetrack
Geotab’s patented curve-based data logging algorithm was tested against highly calibrated telemetry sensors. The vehicle tracking devices running curve and parameter-based logic ran simultaneously to ensure data integrity. The goal was to validate variances and increased or decreased accuracy of information captured at scale for real-time processing and notification of both logging methods.
Multiple driving scenarios were performed using two medium-duty panel trucks during the test: only one truck was loaded to simulate a delivery load. Each truck had GO8, and GO9 devices installed, but the devices were set to two different configurations: parameter-based logic and curve-based logic, running in parallel for data integrity.
To validate the quality of the data that the GO device transmits, the data collected during the test was compared to results from a Racelogic VBOX 3iSL RTK 100 Hz dual antenna high precision data logger in conjunction with a VBOX Video HD2 data and video logger. The VBOX 3iSL RTK is known for its high precision and performance.
After analyzing and comparing the data between the GO device and the VBOX 3iSL RTK, the data revealed that the GO device is comparable to the high-performance VBOX 3iSL RTK and that a curve-based algorithm is most efficient. Mecanica concluded that the GO device and Geotab’s curve-based algorithm provide high-performance data detail and data quality.
Mechanica conducted the telematics device test at Buttonwillow Raceway Park in California.
Test summary
Test site and vehicles
The tests were carried out on a 1.86-mile loop track at Buttonwillow Raceway Park in Southern California. The road racing and test facility plays host to car and motorcycle track days, test days, and performance driving clinics.
Vehicles selected for the test:
- one medium-duty panel truck (loaded)
- one identical medium-duty panel truck (unloaded)
Mecanica Scientific Services Corp. (Mecanica) conducted the tests and compiled the results. The scientific and engineering consulting firm specializes in highway safety research, collision reconstruction and analysis, industrial engineering, and other services. Mecanica was also selected by SAE to host its professional development courses for engineers and technicians.
Validation provided by VBOX Automotive precision systems
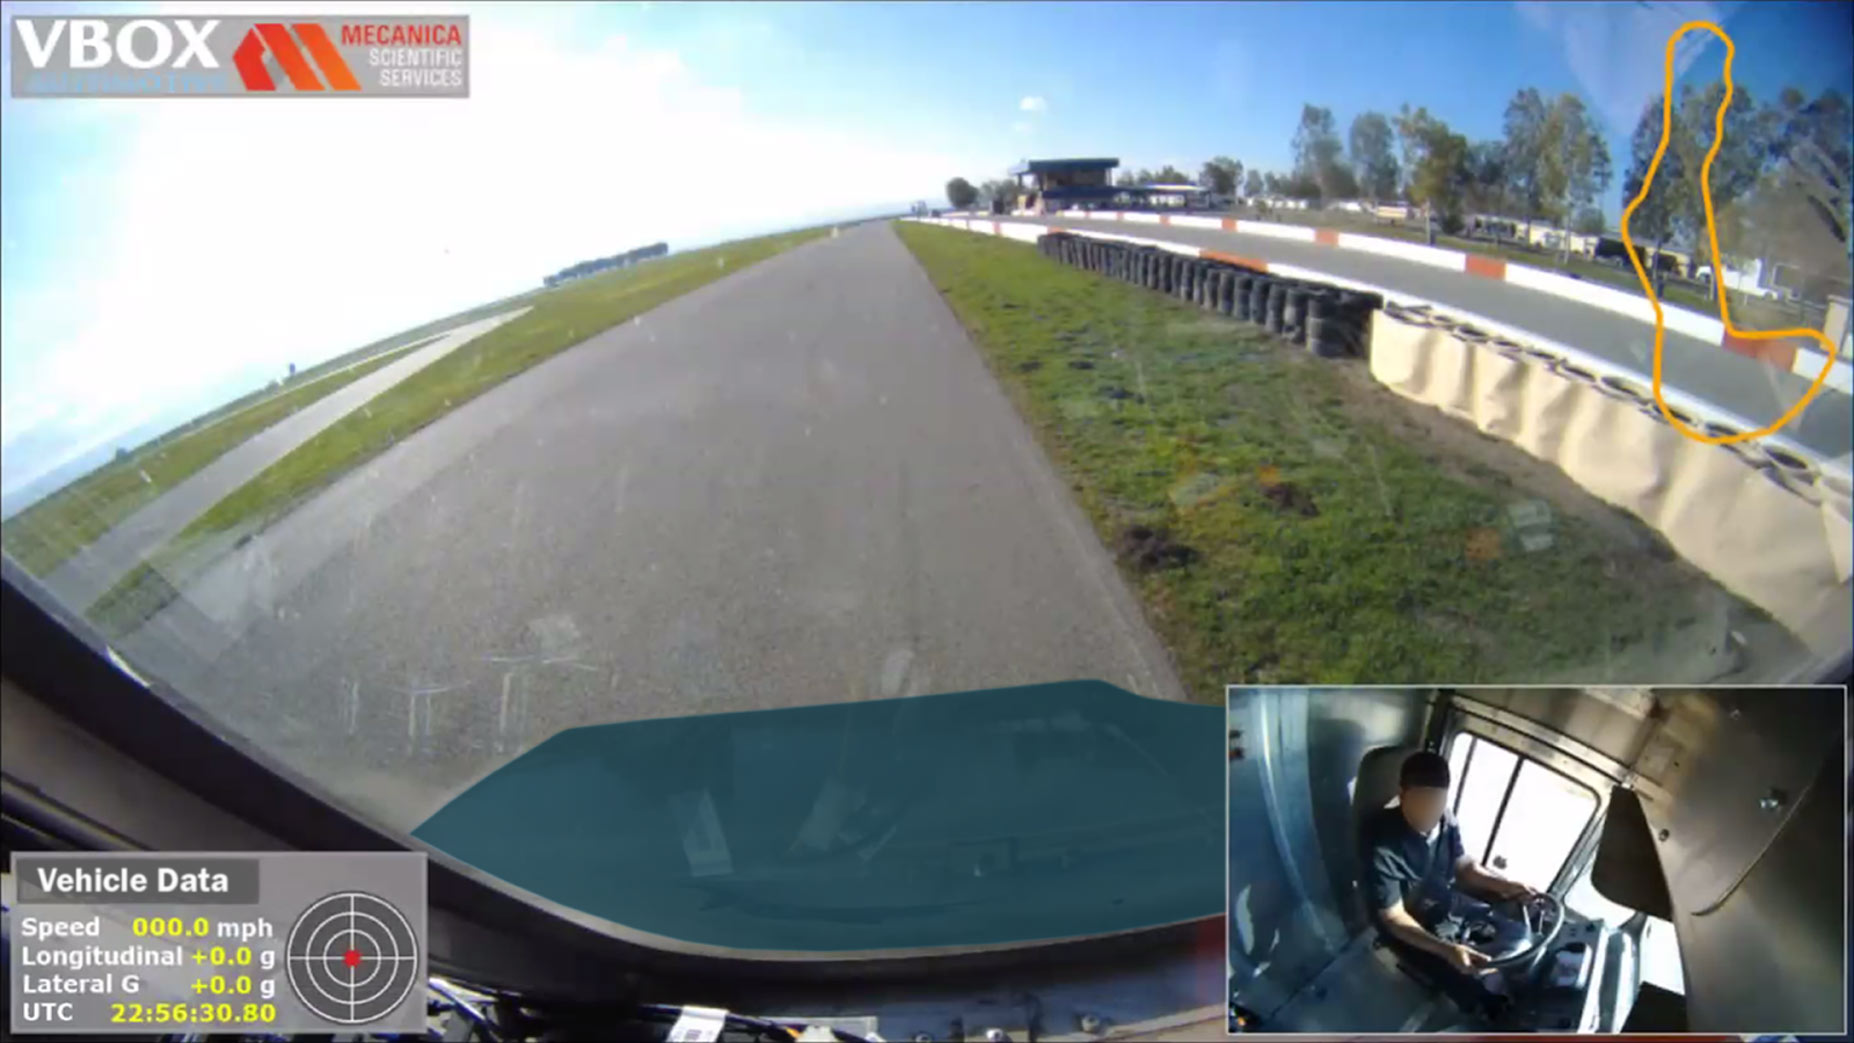
To validate the speed, distance and acceleration measurements, test engineers installed a Racelogic VBOX 3iSL RTK 100 Hz dual antenna high precision data logger in conjunction with a VBOX Video HD2 data and video logger. The 100 Hz data logging means we are capturing data 100 times a second. GPS positional data logged by the VBOX 3iSL RTK was corrected by a Racelogic RTK-enabled fixed base station broadcasting correction signals to provide 2-cm accuracy on logged position data.
The Racelogic VBOX data logger system is an internationally recognized high accuracy GPS data logging tool. Vehicle manufacturers, tire manufacturers, and suppliers use Racelogic for elite applications such as testing autonomous and advanced driver assistance systems (ADAS) and collision forensics. Racelogic data loggers record high accuracy GPS speed measurements, distance, 6-axis acceleration and rotation, braking distance, heading, slip angle, plus lap times, position, and more. High-definition (HD) video of the test runs was also recorded.
Sample VBOX dashboard with video and graphic overlay.
Testing data analysis
The focus areas for the test were data quality, vehicle dynamics, and device triggers. Test engineers looked at how well the devices captured changes in vehicle speed and detected vehicle maneuvers.
A variety of test runs were performed:
- Acceleration to steady-state to braking (with normal and full braking from 25, 45, and 60 MPH)
- Reversing on a hill (while in neutral and in reverse gear)
- Dynamic test runs (at 25 and 45 MPH with normal and aggressive lane changes)
- Simulated, repeated stop signs
- Specialty runs (repeated stops, inconsistent acceleration and deceleration, random driving and a three-point turn)
Head-to-head testing scenarios: Evaluation of parameter and Geotab patented curve-based logging
In each truck, both GO8 and GO9 units were installed in a cluster. The devices were set to different configurations but ran simultaneously to ensure data integrity:
- Parameter-based logic: A parameter-based algorithm will identify and log data points based on certain parameter-defined events occurring, such as a change in the heading (direction) or speed. As well as a change in a monitored input such as a change in the ignition state, seatbelt or other monitored auxiliary inputs.
- Curve-based logic: Curve logging is Geotab’s patented data collection method for processing large amounts of telematics data. Geotab GO devices help to minimize data transmission by transmitting only the necessary data produced by the sensor directly. It then applies an algorithm that determines which data points carry meaningful information to be collected and transmitted. It also identifies data points that are redundant. For example, if a driver navigates around city streets, data points will only be flagged for key turns which are points of maximum error. Learn more about curve-based logic in this article by Geotab’s CEO, Neil Cawse.
A properly installed device will support device communication and data quality. For installation guides, refer to Geotab’s Installation Documentation.
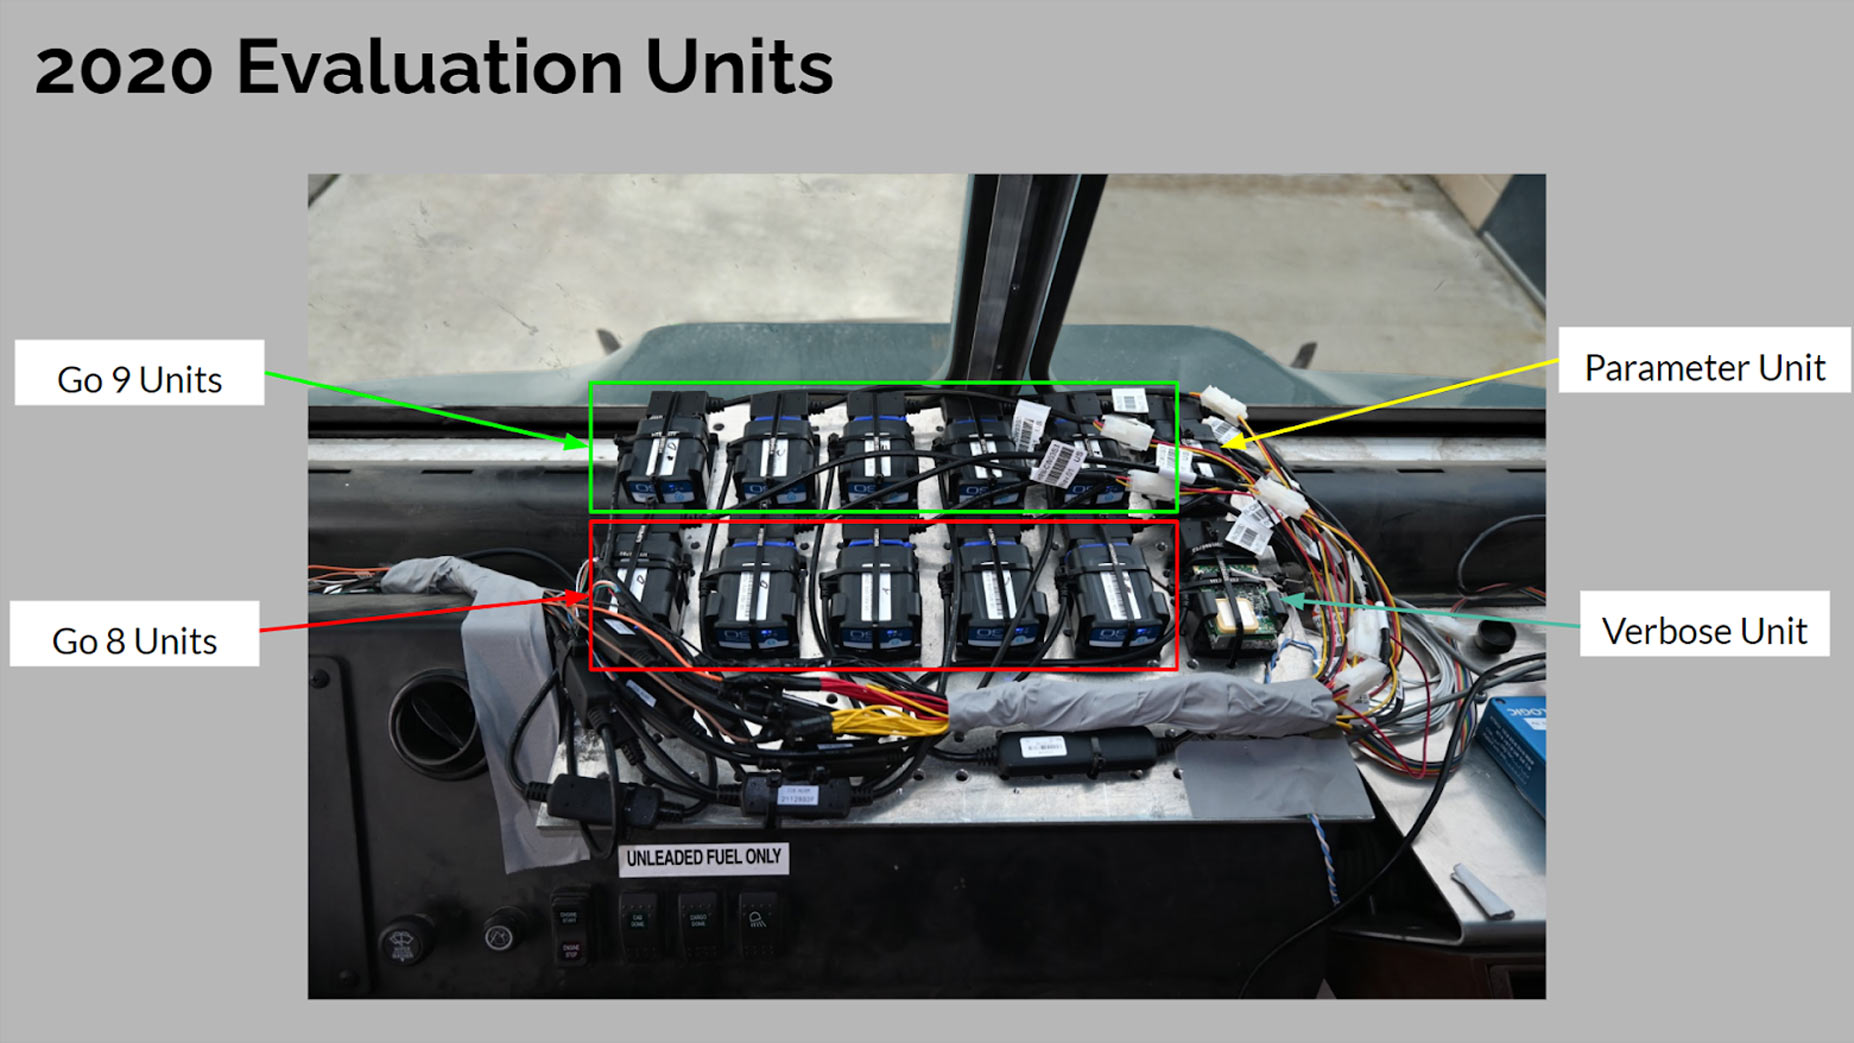
Evaluation units were installed in each truck.
During testing, the Mecanica research team constantly monitored data collection integrity from the VBOX system. They ensured that tests ran as planned and the data was collected without technical issues or problems. Upon completion of the closed track test runs, the team created backups of all test data and documentation media backed up to our secure servers. Then the data was reviewed, sorted, and parsed to prepare the data for comparison and analysis to the Racelogic VBOX data set and video files.
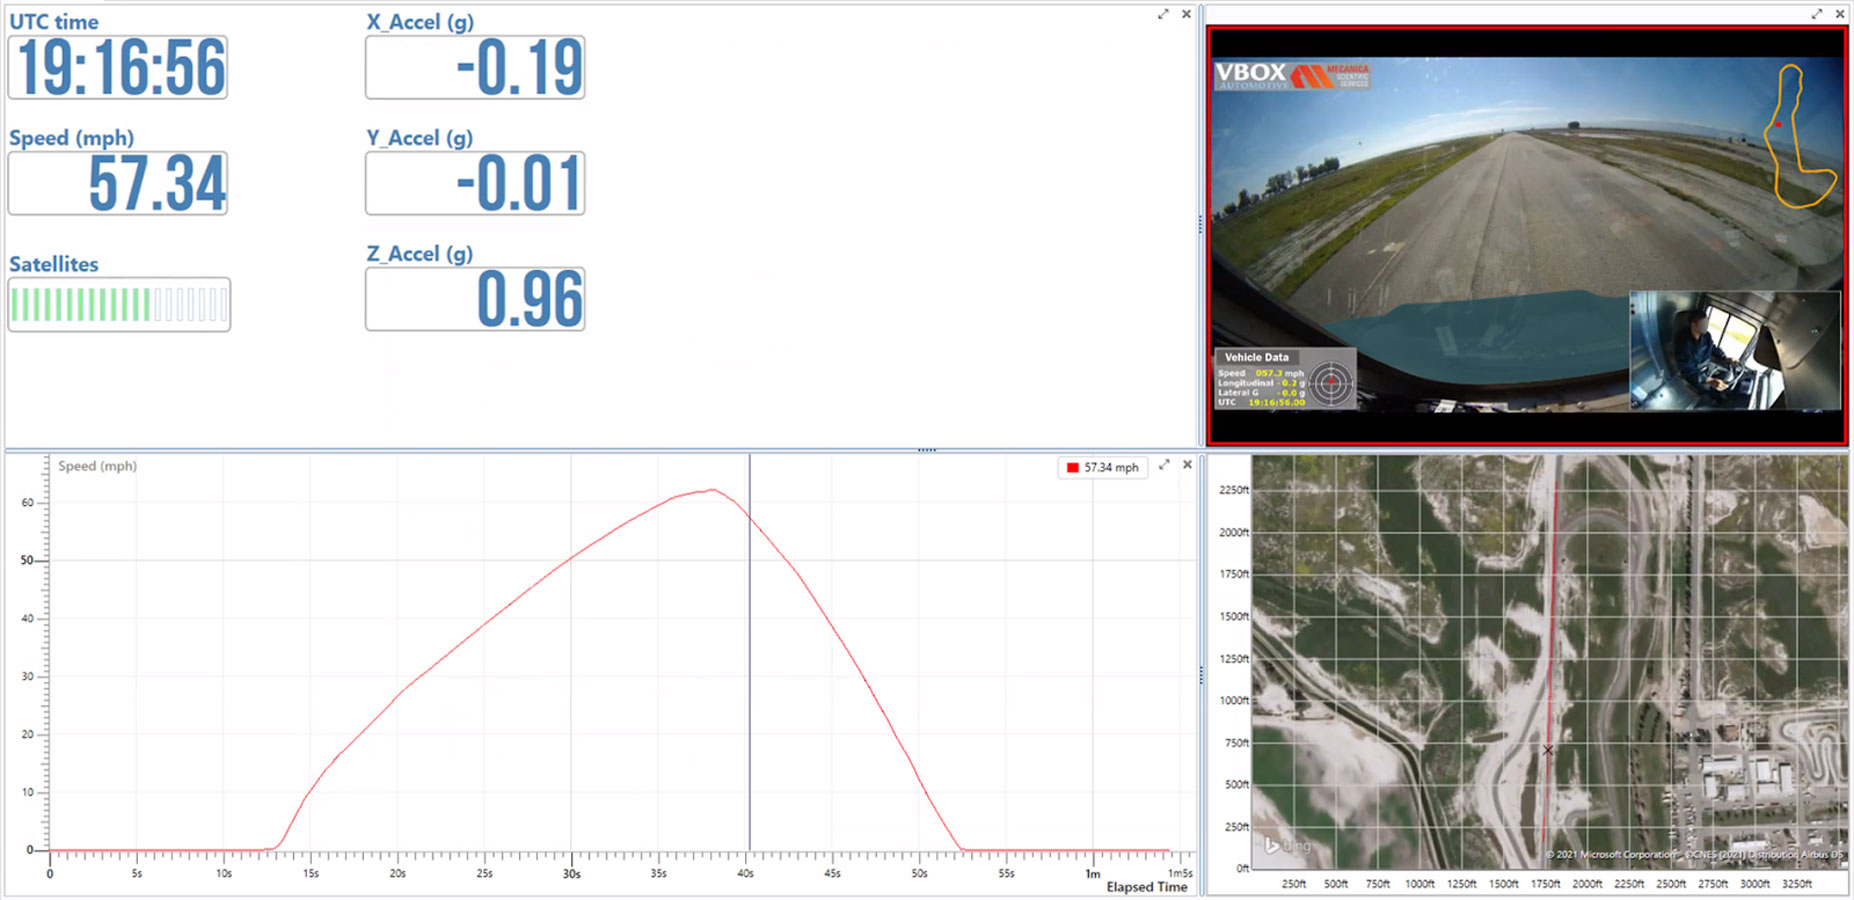
Once the baseline VBOX data was synched with the test Geotab unit data, an in-depth analysis was conducted using advanced tools such as MathWorks MATLABⓇ. MATLABⓇ allows our research team to identify issues in time reporting and the accuracy of data when compared to the 100 Hz VBOX data. An example of the vehicle speed-time history and the accelerometer-time history analysis is shown above in Figure 1.
The results: Test reveals Geotab provides detailed quality data with consistency
A review and analysis of this data revealed that for day-to-day vehicle fleet management and real-time reporting, the Geotab curve logging algorithm provides detailed, quality data. The volume of data points is reduced, along with data transmission and storage volumes. The load did not impact data quality.
Testing in this study was conducted using a mostly empty truck, aside from our test equipment, a monitoring engineer and a driver. The other truck was loaded with 2,527 pounds of sandbags to simulate a typical load of parcels, and how a delivery truck would respond in a real-life situation. On medium-duty commercial trucks, there aren’t typically any drastic differences in acceleration performance between loaded and unloaded vehicles, especially ones powered by turbo-diesel engines.
Another interesting finding in the study was the consistent data quality. A comparison of the unloaded and loaded truck test results showed that the quality of data recorded by the GO devices didn’t change based on the load.
Vehicle dynamics
Lateral-longitudinal acceleration scatter plots were created for each run and truck (loaded and unloaded). Scatter plots were compared between “normal” driving behaviors and “full” or “aggressive” maneuvers.
To help identify and understand the difference in what are typical or normal vehicle maneuvers such as acceleration, braking, turning and lane-change maneuvers, we used seasoned drivers for each vehicle type, and had drivers follow a strict and standardized testing regimen.
Vehicle dynamics were measured and plotted by test run to visualize what the normal or typical driving dynamics look like compared to aggressive braking, accelerating, lane changes and turning maneuvers.
Aggressive braking is maximum braking achieved by aggressively and fully pushing on the brake pedal as if in an emergency avoidance maneuver. The aggressive turning and lane-change maneuvers were also aggressive, emergency avoidance maneuvers.
An example of the plotted aggressive versus normal driving data is shown below.
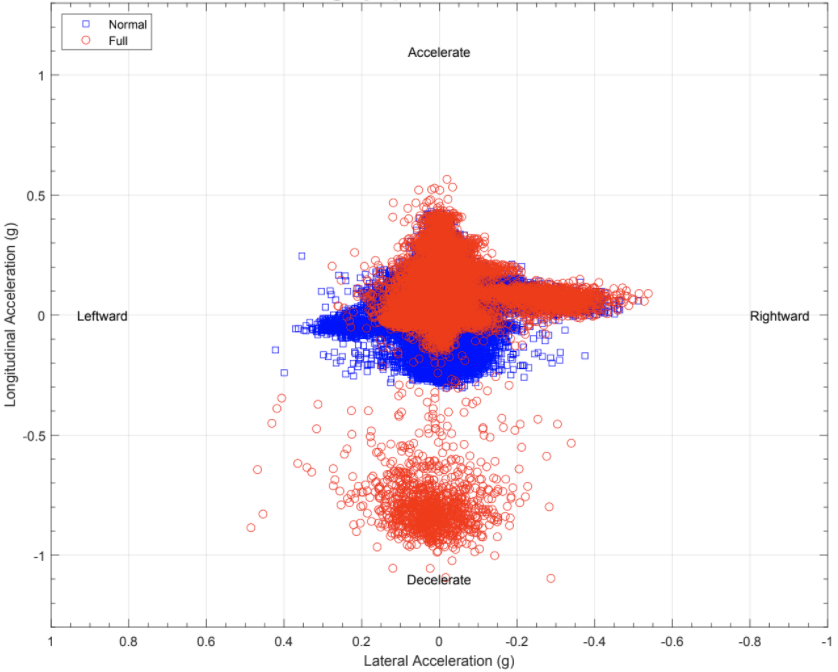
Normal versus aggressive driving accelerometer data.
Curve-based logging triumphs with greater accuracy and less server overload
Looking at the results of the Geotab GO units in the parameter-mode units versus the curve-based mode units, the curve-based approach had fewer data points and still captured the speed changes. With traditional parameter logging, the volume of data points can overload the server’s processing capability.
Geotab uses a curve-based algorithm (which uses the Ramer-Douglas-Peucker algorithm) in its firmware to determine which of the data points should be saved and transmitted to MyGeotab.
By reducing the number of data points, and constantly checking the points of maximum error, the solution delivers accurate, reliable vehicle performance, health, safety, and location data. This data helps customers to see a more accurate picture of their vehicle route accuracy and mitigate the impact of any route tracking confusion with routing relative to obstacles like buildings and parks. Further, it helps gather critical driving behavior information.
.png)
Comparison of vehicle speed, longitudinal acceleration and acceleration error in devices tested.
“Geotab GPS based fleet telematics packs an incredible amount of capabilities into a tiny package that is robust enough to connect to a wide variety of vehicle types, and to have logic that can cut data volume by 30% but maintain quality for fleet management is an incredible feat.”
— John Steiner, CEO and Principal Scientist at Mecanica Scientific Services
Manage fleet risk and safety with vehicle tracking technology
How can fleets reduce the risk of everyday operations and keep collisions and costs under control? One asset that is extremely useful for managing risk and safety is fleet data. From understanding miles driven, to knowing CO2 emissions and detecting collisions, data is the key to getting a real-time view of what’s happening out in the field.
Fleet Business states, “Data is the future of fleet management.” Digitalization, or the use of digital technology to find new business efficiencies and opportunities for revenue or savings, is an increasing trend among transportation companies.4
Fleets are going digital for safety benefits such as the ability to detect risky driving, but also for other areas including real-time tracking of customer orders en route and zero-contact transactions.5
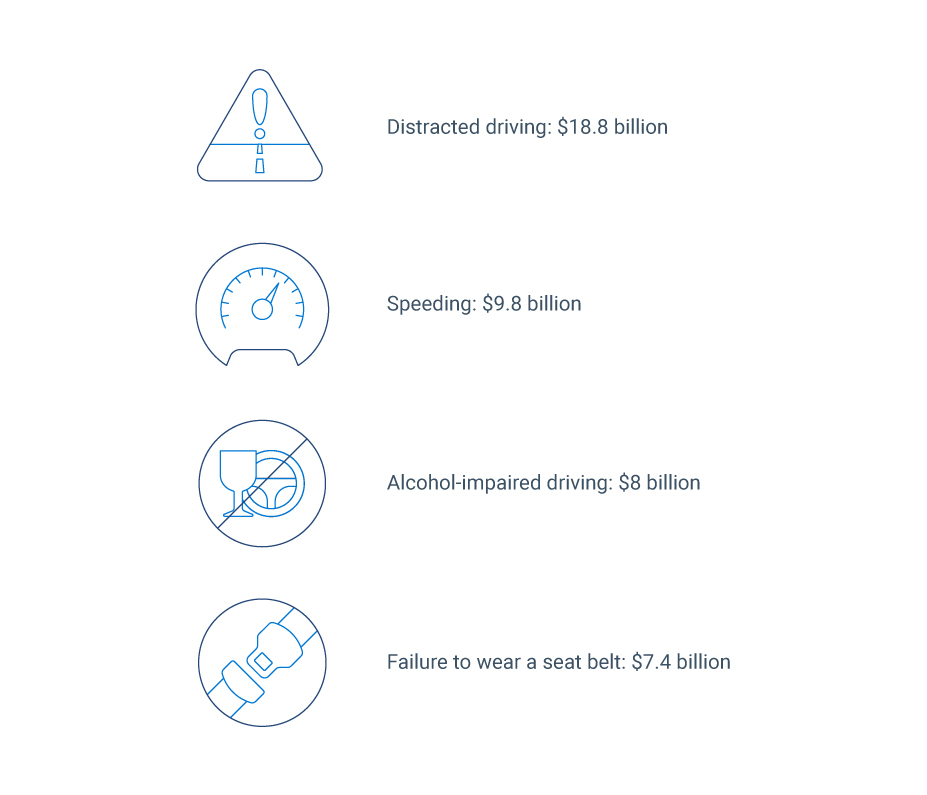
Reducing vehicle crashes is a major focus for many fleets, as the cost of ignoring safety and risk can be enormous.6 U.S. traffic collisions cost employers $72.2 billion in 2019, according to a report from the Network of Employers for Traffic Safety (NHTSA), “Cost of Motor Vehicle Crashes to Employers — 2019.”8 The costs covered by employers resulting from vehicle collisions include health fringe benefit payments, Workers’ Compensation, disability and health insurance, life insurance and sick leave. Costs also extend to vehicle damage and replacement, property damage, disruption in the workplace and lost productivity. Speeding, harsh braking or collisions with fleet vehicles can also damage a company’s reputation.
Another recent NHTSA report found that 38,680 fatalities occurred on American roads in 2020, the highest number in thirteen years, despite vehicle miles traveled decreasing by 13.2 percent that year. The top contributors to those fatalities included speeding, distracted driving, alcohol, and failure to wear a seat belt.9
Total employer costs for vehicle crashes by risk factor:
Connected vehicle technology enables the analysis of risk-related driving data
Fleet managers can use Geotab’s driver scorecard report to discover the riskiest drivers so they can receive coaching for improvement, as well as to recognize and reward the safest drivers. In cases where a vehicle is equipped with an integrated camera solution, companies can also collect road condition information.
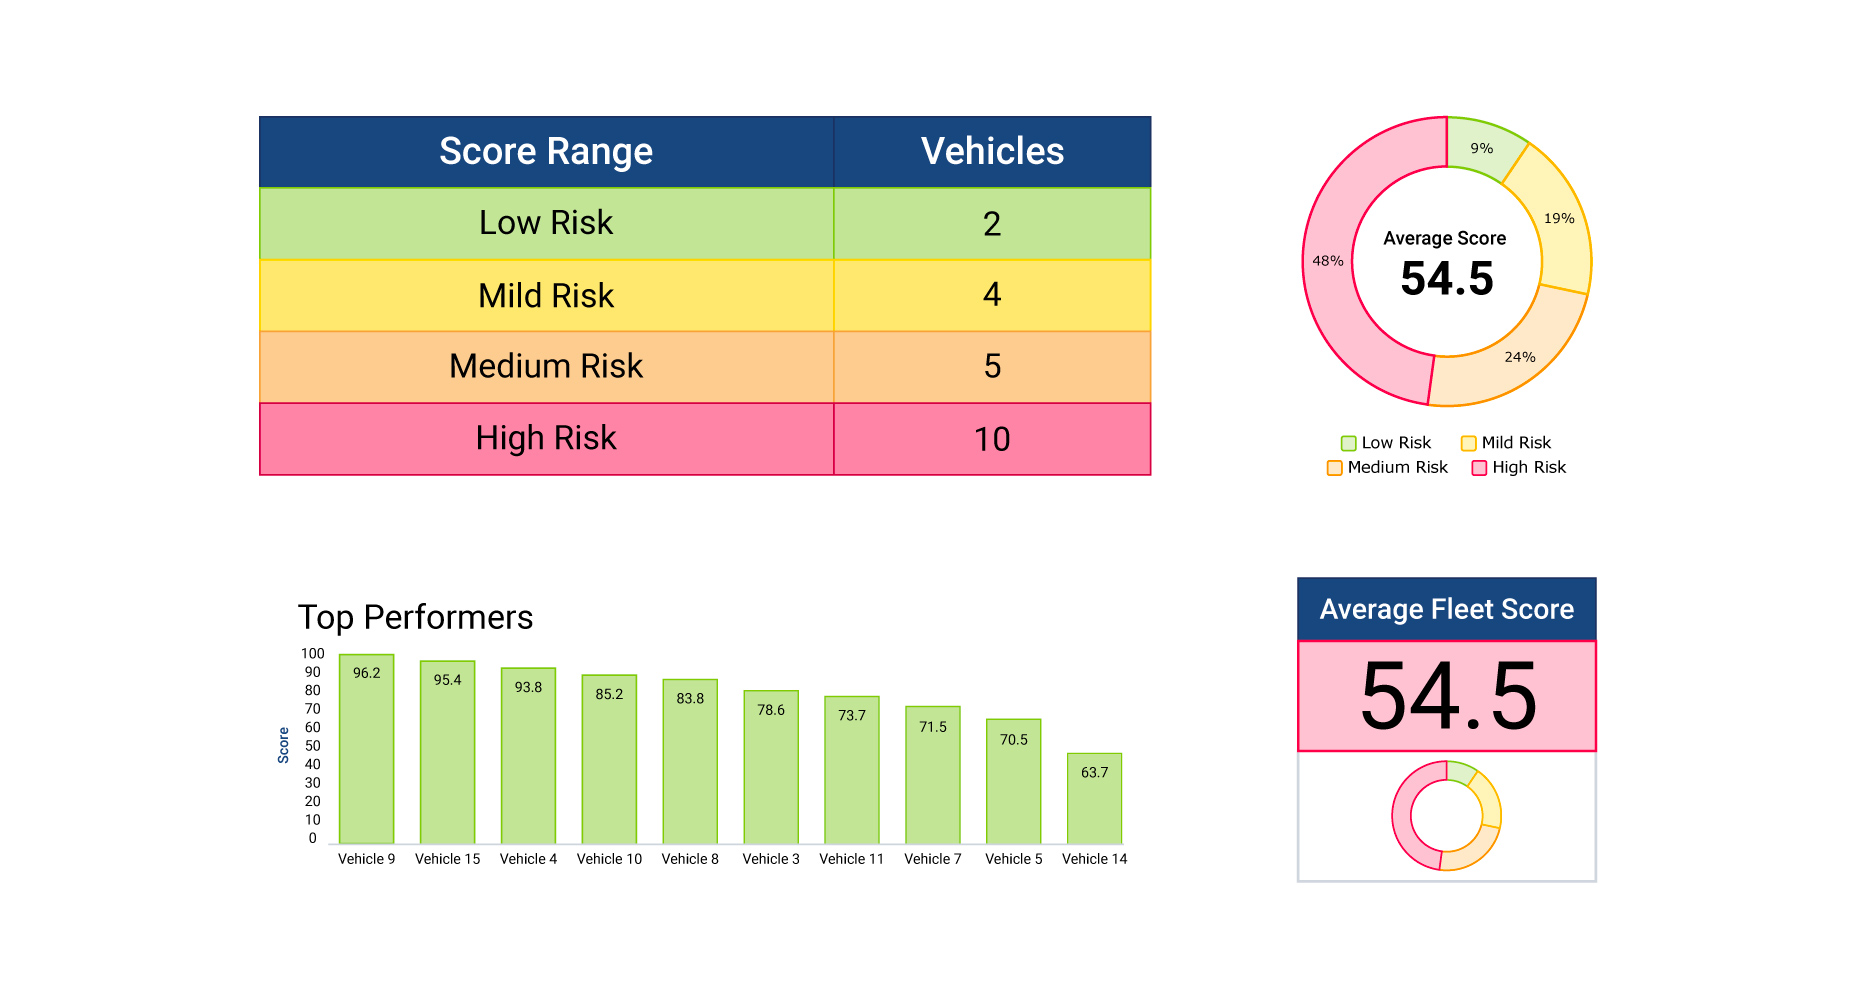
The Geotab Driver Safety Scorecard Report shows the risk classification (low, mild, medium, high) for each vehicle.
Fleet managers can use a driver scorecard report to discover the riskiest drivers so they can receive coaching for improvement, as well as to recognize and reward the safest drivers. In cases where a vehicle is equipped with an integrated camera solution, companies can also collect road condition information. Video telematics is expected to grow exponentially, as, in 2021, only 5% of vehicles were equipped with video telematics.10
How fleet risk management solutions work
An open platform fleet risk management solution is a flexible system that starts with hardware and software and can be expanded and added on to according to the fleet’s needs.
The Geotab fleet management solution consists of:
Geotab GO TALKTM is an in-vehicle verbal coaching solution that delivers spoken alerts to drivers in near real-time to improve fleet safety and productivity. This driver coaching tool can be used to support any number of fleet policies and goals, such as decreasing collisions, improving safety and compliance, and reducing costs.
Collision reconstruction with telematics provides a better understanding of the events before, during and after a crash — information that is useful for insurance, driving training or litigation purposes.
Adding engine diagnostics to GPS tracking is a best practice for managing risk and liability, as it provides critical information about vehicle health.11 Telematics provides many other benefits to businesses as well, helping them meet service level obligations and keeping customers happy through route optimization and live vehicle tracking to support the communication of accurate package ETAs.
- Geotab GO vehicle tracking devices
- MyGeotabTM fleet management software
- Marketplace of integrated third-party Apps, Add-Ins and Add-Ons, such as dash cams, ADAS, asset tracking and fuel management
- Data analytics tools and fleet benchmarking
- Software development kit and APIs
The Geotab GO connects to a car or truck by plugging into the OBDII or CAN-BUS port, and transmits critical vehicle data and engine diagnostics over the cellular network, information such as odometer, vehicle speed, distance, fuel level, RPM, idling, and for electric vehicles, EV energy use and battery charge percentage.12 The basic components within the telematics device are the GPS receiver, engine interface, input/output interface (expander port), SIM card, buzzer and an accelerometer.13
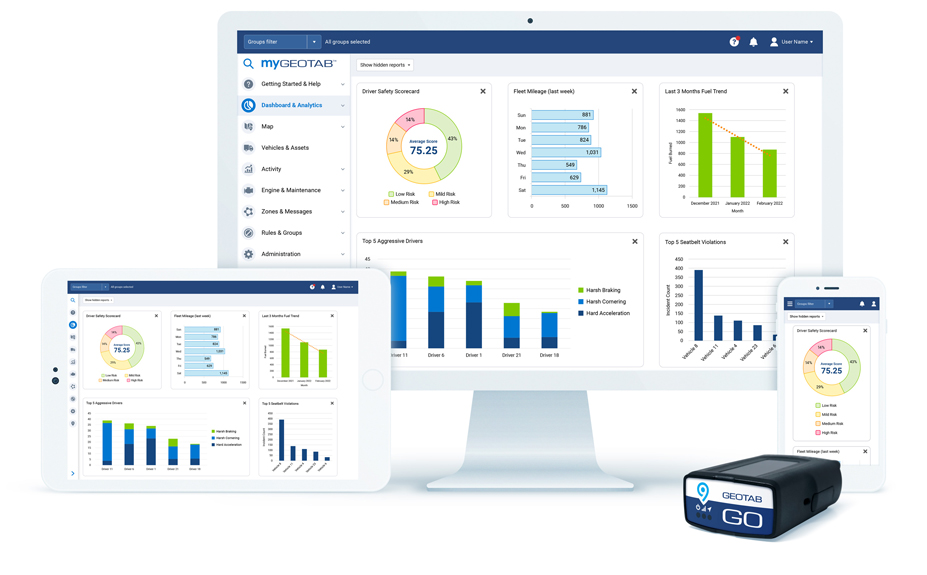
Via Geotab’s patented curve logging algorithm, data is moved efficiently from the vehicle to the server.14 On the other side, the fleet manager can view and report on data trends from a single pane of glass — through the fleet management software, which is accessible from a desktop computer, smartphone or tablet.
Simplify driver risk management and safety coaching with Geotab
A diverse range of businesses and government organizations across North America, and around the world, rely on telematics and fleet management software. Having access to reliable data sources is essential for business. When managers have a true line of sight into operations, they can more easily identify opportunities for improvement, such as reducing collisions, lowering fleet costs, strengthening compliance to regulations, shortening route times and even improving sustainability — all tasks which are even more important in challenging economic times.
On the race track, teams use telematics to fine-tune their performance.14 Though a delivery vehicle is not a race car, fleet managers can still use real-time data to find ways to improve driver safety and lower risk, increase productivity and efficiency, enhance compliance and sustainability, while staying up-to-date on vehicle conditions to support utilization and maintenance. Delivery companies can get a competitive advantage with insights from a curve logic method of logging, which gathers just enough data points for dispatchers to help ensure drivers are keeping to their designated routes and making their scheduled urban or suburban stops while driving safely.
Take the telematics test
Learn more about using Geotab to reduce risky driving behaviors and promote safer habits. Conduct a side-by-side comparison of your current telematics devices, dashcam video recorders or other in-vehicle technologies with Geotab to validate their capabilities. Find out what driving events you might be missing.
To get started, visit Geotab.com and request a demo.
References
1. Antich, Mike. “15 Predictions for the Fleet Market in CY 2022.” Automotive Fleet. January 1, 2021.
https://www.automotive-fleet.com/10157307/15-predictions-for-the-fleet-market-in-cy-2022
2. Vanover, Jason. “Renewed Focus on Last Mile Delivery Service During COVID-19 Pandemic Disruption.” Supply Chain 247. April 24, 2020. https://www.supplychain247.com/article/renewed_focus_on_last_mile_delivery_service_during_disruption
3. UNCTAD. “COVID-19 has changed online shopping forever, survey shows.” October 8, 2020.
https://unctad.org/news/covid-19-has-changed-online-shopping-forever-survey-shows
4. Miller, Susan. “Driver safety: How fleet managers can put the brakes on speeders.” Geotab. October 24, 2019.
https://www.geotab.com/blog/driver-safety-for-speeders/
5. Fletcher, Lauren. “Preventing Accidents Through Technology.” Automotive Fleet.
https://www.automotive-fleet.com/10154540/preventing-accidents-through-technology
6. Network of Employers for Traffic Safety. “Cost of Motor Vehicle Crashes to Employers — 2019.” Network of Employers for Traffic Safety. March 2021.
7. National Highway Traffic Safety Administration. “2020 Fatality Data Show Increased Traffic Fatalities During Pandemic.
8. Fleet Business. “Fleet industry trends: 8 Predictions for 2022.” FleetBusiness.com.January 31, 2020.
https://www.fleetbusiness.com/features/fleet-industry-trends-8-predictions-for-2022
9. Gartner. “Information Technology Glossary.”
10. Huff, Aaron. “Digital strategies of fleets predicted to expand in key areas for 2021.” Commercial Carrier Journal. December 16, 2020.
https://www.ccjdigital.com/business/article/14940195/fleets-digital-strategies-to-expand-forkey-
11. Guter, Jordan. “Engine diagnostics or GPS only tracking: Which is better?” Geotab. February 13, 2018.
https://www.geotab.com/blog/engine-diagnostics/
12. Geotab Team. “What is telematics?” Geotab. March 26, 2021.
https://www.geotab.com/blog/what-is-telematics/
13. Geotab. “Fleet tracking Device”
https://www.geotab.com/vehicle-tracking-device/
14. Cawse, Neil. “How the curve algorithm for GPS logging works.” Geotab. April 28, 2017.
https://www.geotab.com/blog/gps-logging-curve-algorithm/
15. Haupt, Nadine. “Fine-tuning fleet performance with data.” Geotab. June 21, 2017. https://www.geotab.com/blog/fleet-performance/
Acknowledgments
Geotab would like to thank Mecanica Scientific Services CEO and Chief Scientist, John C. Steiner, and his team for the valuable contributions and expertise they contributed to the development of this report.
About Geotab
Geotab is advancing security, connecting commercial vehicles to the internet and providing web-based analytics to help customers better manage their fleets. Geotab’s open platform and Marketplace, offering hundreds of third-party solution options, allows both small and large businesses to automate operations by integrating vehicle data with their other data.
As an IoT hub, the in-vehicle device provides additional functionality through IOX Add-Ons. Processing billions of data points a day, Geotab leverages data analytics and machine learning to help customers improve productivity, focus on sustainability, optimize fleets through the reduction of fuel consumption, enhance driver safety, and achieve strong compliance to regulatory changes. Geotab’s products are represented and sold worldwide through Authorized Geotab Resellers. To learn more, please visit www.geotab.com and follow us @GEOTAB and on LinkedIn.
This white paper is intended to provide information and encourage discussion on topics of interest to the telematics community. Geotab is not providing technical, professional or legal advice through this white paper. While every effort has been made to ensure that the information in this white paper is timely and accurate, errors and omissions may occur, and the information presented here may become out-of-date with the passage of time.
Post Tags
About Geotab
Geotab is a global leader in connected operations, video telematics and AI-powered insights. Trusted by more than 100,000 customers — from small and mid-size fleets to Fortune 500 enterprises and public-sector organizations, including the U.S. federal government — Geotab connects approximately 6 million vehicles and assets and processes 100 billion data points daily. With ISO/IEC 27001:2022, SOC2, FIPS 140-3 and FedRAMP authorizations, Geotab's open platform and partner ecosystem unify safety, compliance and operations in a unified system. Our mission: a safer, more efficient and more sustainable world in motion. Learn more at www.geotab.com and follow us on LinkedIn or visit Geotab News and Views.
GEOTAB and GEOTAB MARKETPLACE are registered trademarks of Geotab Inc. in Canada, the United States and/or other countries.
© 2026 Geotab Inc.All Rights Reserved.
This white paper is intended to provide information and encourage discussion on topics of interest to the telematics community. Geotab is not providing technical, professional or legal advice through this white paper. While every effort has been made to ensure that the information in this white paper is timely and accurate, errors and omissions may occur, and the information presented here may become out-of-date with the passage of time.
Recent News

4 ways to unlock the power of quality data
June 30, 2023

.jpg)
Your comprehensive guide to the Canadian ELD mandate
May 16, 2022
-Thumbnail@1x.jpg)
Mining value from connected vehicle data: How OEMs can lead the next-gen of data-enabled services
November 11, 2021