Get started with the MyGeotab API wrapper
Learn how to adapt the API for your business with this helpful MyGeotab API wrapper tutorial by Software Developer Jonathan Stolle.

Oct 31, 2025

Read this helpful MyGeotab API wrapper tutorial to learn how to adapt the API for your business.
On the MyGeotab SDK page, you might have seen many examples on how to perform useful operations on your database with the MyGeotab API. Examples include adding new groups to your database or fetching various data from the Geotab Data Feed for all of your devices.
At its core, the MyGeotab API allows the user to make http requests (using https) to communicate with your database. On the SDK page, there are many examples using .Net (usually with C#) or javascript (also here).
But what if you don’t use either of these? You can use http requests with a programming language of your choice, but there are a few other cases for which we have an API wrapper, one of these being for Python, which will be the focus of this post.
Getting Started
The examples are done using Python 2.7.9 (though most of the code should be compatible with Python 3.x) in Jupyter (formerly IPython). That being said, if you are experienced with Python and have your own favourite IDE, you can follow along with that instead.
Refer to the MyGeotab SDK, SDK forum, or the mygeotab-python documentation to get more insight into using the api wrapper.
A First Code
Let’s start with a small code example involving retrieving data from your database. Start with installing mygeotab with the package manager, pip:
!pip install ––upgrade mygeotab
Import the libraries:
import mygeotab as mg
import getpass
Login to your database (you can specify the server in mg.API, but if you do not, you will be routed through my.geotab.com to the server your database is on). Note that once you have successfully logged in, the password will be replaced by a session_id:
# input() instead of raw_input() in Python 3
database = raw_input (“Database: ”)
username = raw_input (“Username: ”)
password = getpass.getpass(“Password: ”)
api = mg.API(database=database, username = username, password = password)
api.authenticate()
password = None
# After saving password, password is set to none, but session_id is set to authenticate calls
print(api.credentials.password == None)
print(api.credentials.session_id == None)
True
False
As a simple these you can get all devices and see how many devices are in the database and look at a specific property of a given device:
# Get all devices
devices = api.call(‘Get’, typeName = ‘Device’)
print(len(devices))
# Result is a list of objects
print(‘Number of properties in first device’,len(devices[0]))
print(‘Acceleration Warning Threshold’, devices[0][‘accelerationWarningThreshold’])
1336
(‘Number of properties in first device’, 68)
(‘Acceleration Warning Threshold’, 16)
Handling Data
The pandas module is convenient for dealing with large amounts of data. Use pip to install it if you do not already have the module on your computer. The data can be viewed in tabular format and then the statistics of the data are shown.
In this example, engine speed status data is retrieved, partially displaced and the statistics of its data (in rpm) are shown below:
# Read in engine speed status data
params= {‘deviceSearch’,:{‘id’:‘bC6E’},‘diagnosticSearch’:{‘id’:‘DiagnosticEngineSpeedId’}, ‘fromDate’:‘2017-08-12T00:00:00.000Z’}
statusData = api.get(‘StatusData’, search = params, resultsLimit = 1250)
len(statusData)
1250
import pandas as pd
import numpy as np
#insert data to dataframe
timeseries_df = pd.DataFrame(statusData)
timeseries_df.head(5)
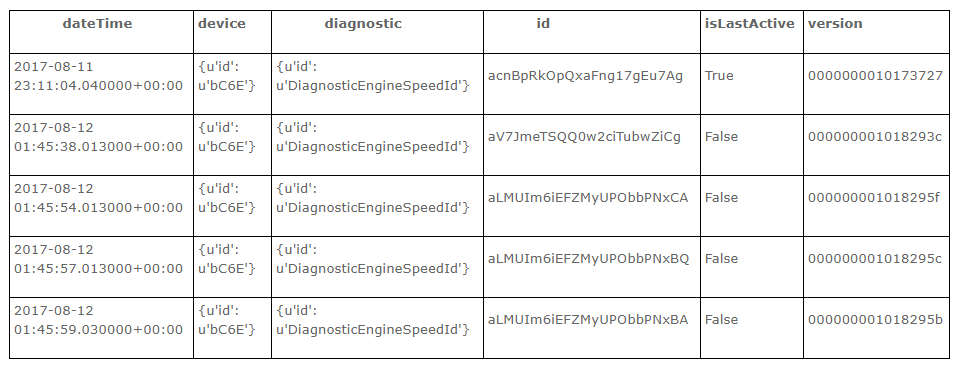
Click to view table larger.
# Clean up data; a further step could be to replace the device id with its name (in devices object)
timeseries_df[‘device’]=timeseries_df[‘device’].map(lambda s: s[‘id’])
timeseries_df[‘diagnostic’]=timeseries_df[‘diagnostic’].map(lambda s: s[‘id’])
timeseries_df[‘dateTime’]=pd.to_datetime(timeseries_df[‘dateTime’])
# Summary statistics
timeseries_df[‘data’].describe()
count 1250.00000
mean 1552.34800
std 611.15978
min 0.00000
25% 987.50000
50% 1520.50000
75% 2052.00000
max 3690.00000
Name: data, dtype: float64
Plotting Results
Visualization is an important tool for understanding your data. Pandas has a convenient matplotlib interface (pylab), though there are many other good plotting libraries available in Python.
Below, I start with a naive plot, showing the data as is. Then I separate the data by day and look at the time in the local timezone to get a better visualization. Finally, I look at the data over a narrow time range to see exactly what it looks like for a few close together trips.
# ‘%matplotlib inline’ is a magic command for jupyter
import pylab
%matplotlib inline
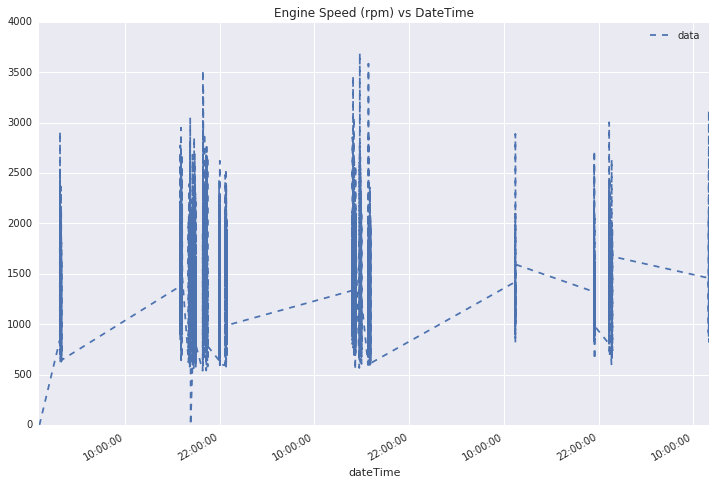
# Make initial plot
timeseries_df.plot(title=‘Engine Speed (rpm) vs DateTime’,x=‘dateTime’,y=‘data’,figsize=(12,8),
linestyle=‘dashed’)
<matplotlib.axes._subplots.AxesSubplot at 0x7f7886fd3ad0>
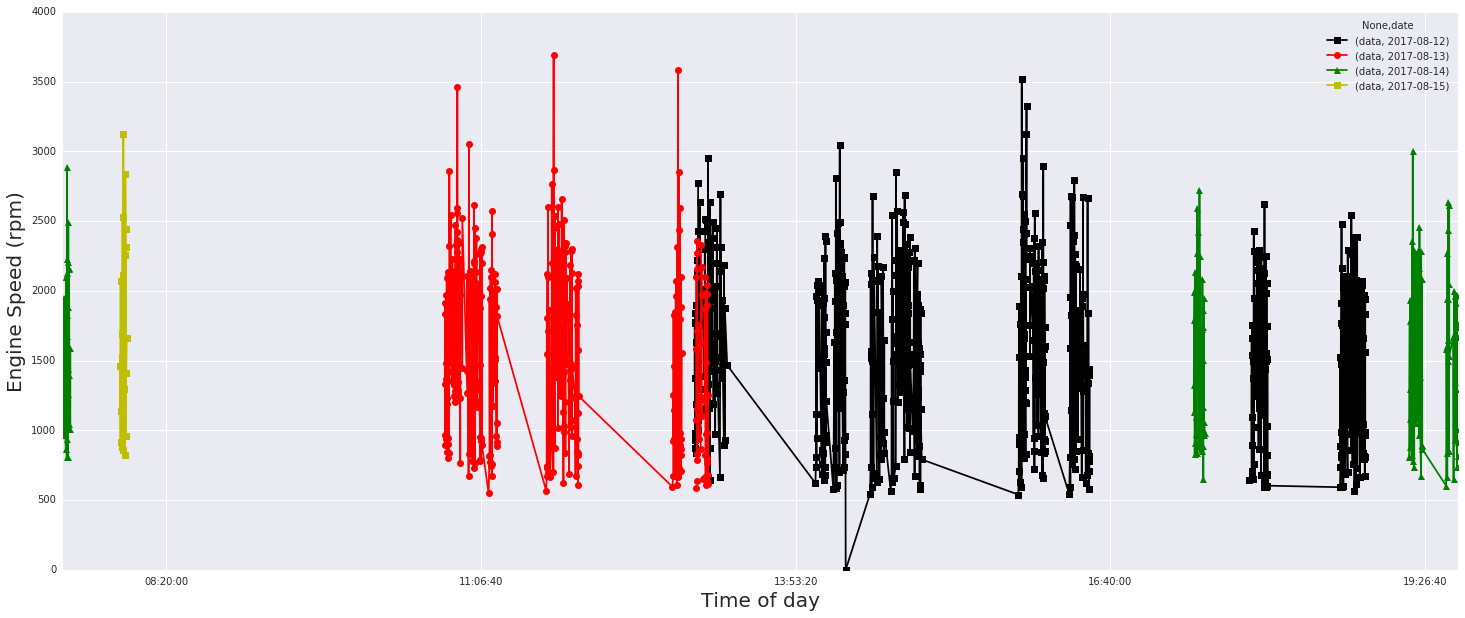
# Adjust plot time data to local time zone (from utc)
import datetime
from dateutil import tz
tzlocal=tz.tzoffset(name=‘EST’,offset=-14400)
timeseries_df[‘dateTime’]=timeseries_df[‘dateTime’].map(lambda s: s.astimezone(tzlocal))
# To see data more clearly, separate by day
timeseries_df[‘date’]=timeseries_df[‘dateTime’].map(lambda s: s.date())
timeseries_df[‘time’]=timeseries_df[‘dateTime’].apply(lambda s: s.time)
# See data from multiple days
searchCondition = timeseries_df[‘date’].map(lambda s: (s > datetime.date(2017,8,11)) and s <
datetime.date(2017,8,16))
pivot_df = pd.pivot_table(timeseries_df[searchCondition],
values=[‘data’], index=[‘time’], columns=[‘date’])
fig=pivot_df.plot(figsize=(25,10),style=[‘ks-’,‘ro-’,‘g^-’,‘ys-’,‘co-’,])
fig.set_ylabel(‘Engine Speed (rpm)’,{‘size’:20})
fig.set_xlabel(‘Time of day’,{‘size’:20})
<matplotlib.text.Text at 0x7f7886e09910>
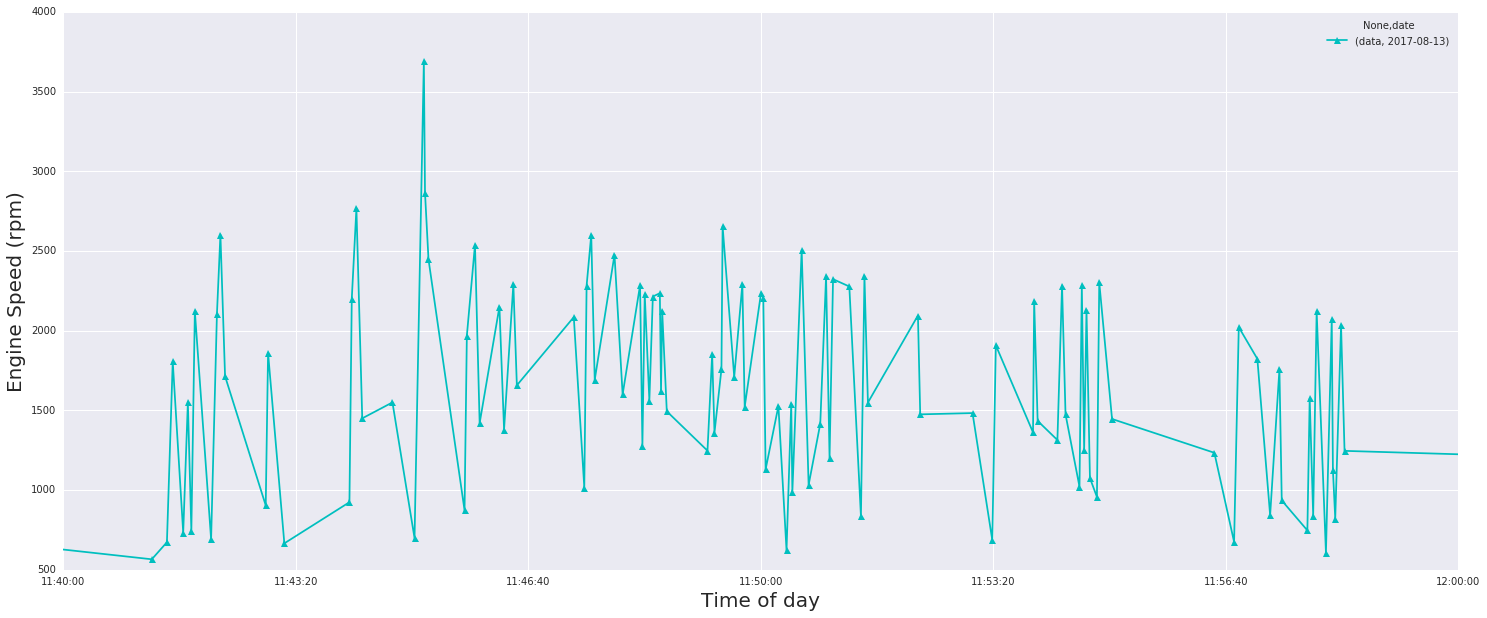
# Zoom in on one part by changing axis limits
searchCondition = timeseries_df[‘date’].map(lambda s: (s > datetime.date(2017,8,12)) and s < datetime.date(2017,8,14))
pivot_df = pd.pivot_table(timeseries_df[searchCondition],
values=[‘data’], index=[‘time’], columns=[‘date’])
fig=pivot_df.plot(figsize=(25,10),style=[‘c^-’,‘ro-’,‘g^-’,‘ys-’,‘ko-’])
fig.set_ylabel(‘Engine Speed (rpm)’,{‘size’:20})
fig.set_xlabel(‘Time of day’,{‘size’:20})
fig.set_xlim(datetime.time(hour=11,minute=40),datetime.time(hour=12, minute = 0))
(42000.0, 43200.0)
Creating Your Own API Wrapper
Geotab has always embraced the open platform approach to allow users flexibility to make the best use of their own data. Many Geotab customers create their own SDK Add-Ins, which can be used by other customers (e.g., the Geotab Marketplace of business-specific solutions). Developing your own API wrapper (say for Java, C++, or another language) or contributing to an existing one is one way you can contribute to the Geotab ecosystem.
Here is an example of how to write one method (a credential-less api call) in Python, though similar functionality can be implemented in other languages. I return the version of MyGeotab on the server on which the database resides in the examples above:
import requests
def MakeCall (serverName, command, payload):
if not (‘https://’ in serverName):
serverName = ‘https://’ + serverName
return requests.get(serverName + ‘/apiv1/’ + command, data=payload).json()
MakeCall(api.credentials.server, ‘GetVersion’, {})
{u’jsonrpc’: u’2.0′, u’result’: u’5.7.1708.338′}
Allows Follow DEV Best Practices
When developing or using api wrappers, be sure to follow the best practices that have been established. For tips, see this collection of blog posts:
- Better Practices for the MyGeotab API
- The Case of the Slow-Poke Query
- 5 Tips on Building Fleet Management Solutions
- DEV Update: New Authentication API Call Limits
If you are just starting out, you might want to check out this Intro to the Geotab Software Development Kit and the DEV channel.
If you have more inquiries about mygeotab api wrappers, check out the SDK forum!
Subscribe to get industry tips and insights
Jonathan Stolle is a Software Developer for Geotab.
Table of Contents
Subscribe to get industry tips and insights
Related posts

Crafting a fleet incident management plan that helps your municipality get ahead of claims
July 16, 2026
5 minute read
.jpg)
Marketplace Spotlight: Redefining Fleet Security with Matrix iQ
July 15, 2026
2 minute read

AI readiness checklist for field service fleets: Is your data ready for AI?
July 6, 2026
1 minute read


How sanitation fleets can prevent return trips and reduce solid waste collection costs
June 15, 2026
3 minute read