Fleet safety ROI: How to prove, measure and improve it
Fleet safety return on investment (ROI) shows the potential financial gains from safety programs, such as reduced collisions and lower insurance costs. Learn step-by-step formulas and key metrics.

By Geotab Team
Oct 6, 2025
Key Insights
- Proving fleet safety ROI starts with a 12-month baseline, e.g., collision counts, insurance premiums and claims data from before any program change. Without it, improvements are invisible to leadership and insurers.
- Leading indicators like harsh events, near-miss rates and driver risk scores tell you where risk is building before a collision occurs. Lagging indicators confirm whether your program is working.
- Top-quartile fleets pay ~$0.06 per mile in insurance versus the $0.07 national average. That gap is the benchmark and verified telematics data is what gets you there.
Why fleet safety ROI matters
With insurance premiums and claim costs climbing, fleet leaders must prove that every safety investment delivers measurable returns. Fleet safety ROI gives you that lens.
Justifies safety investment in a high-cost environment
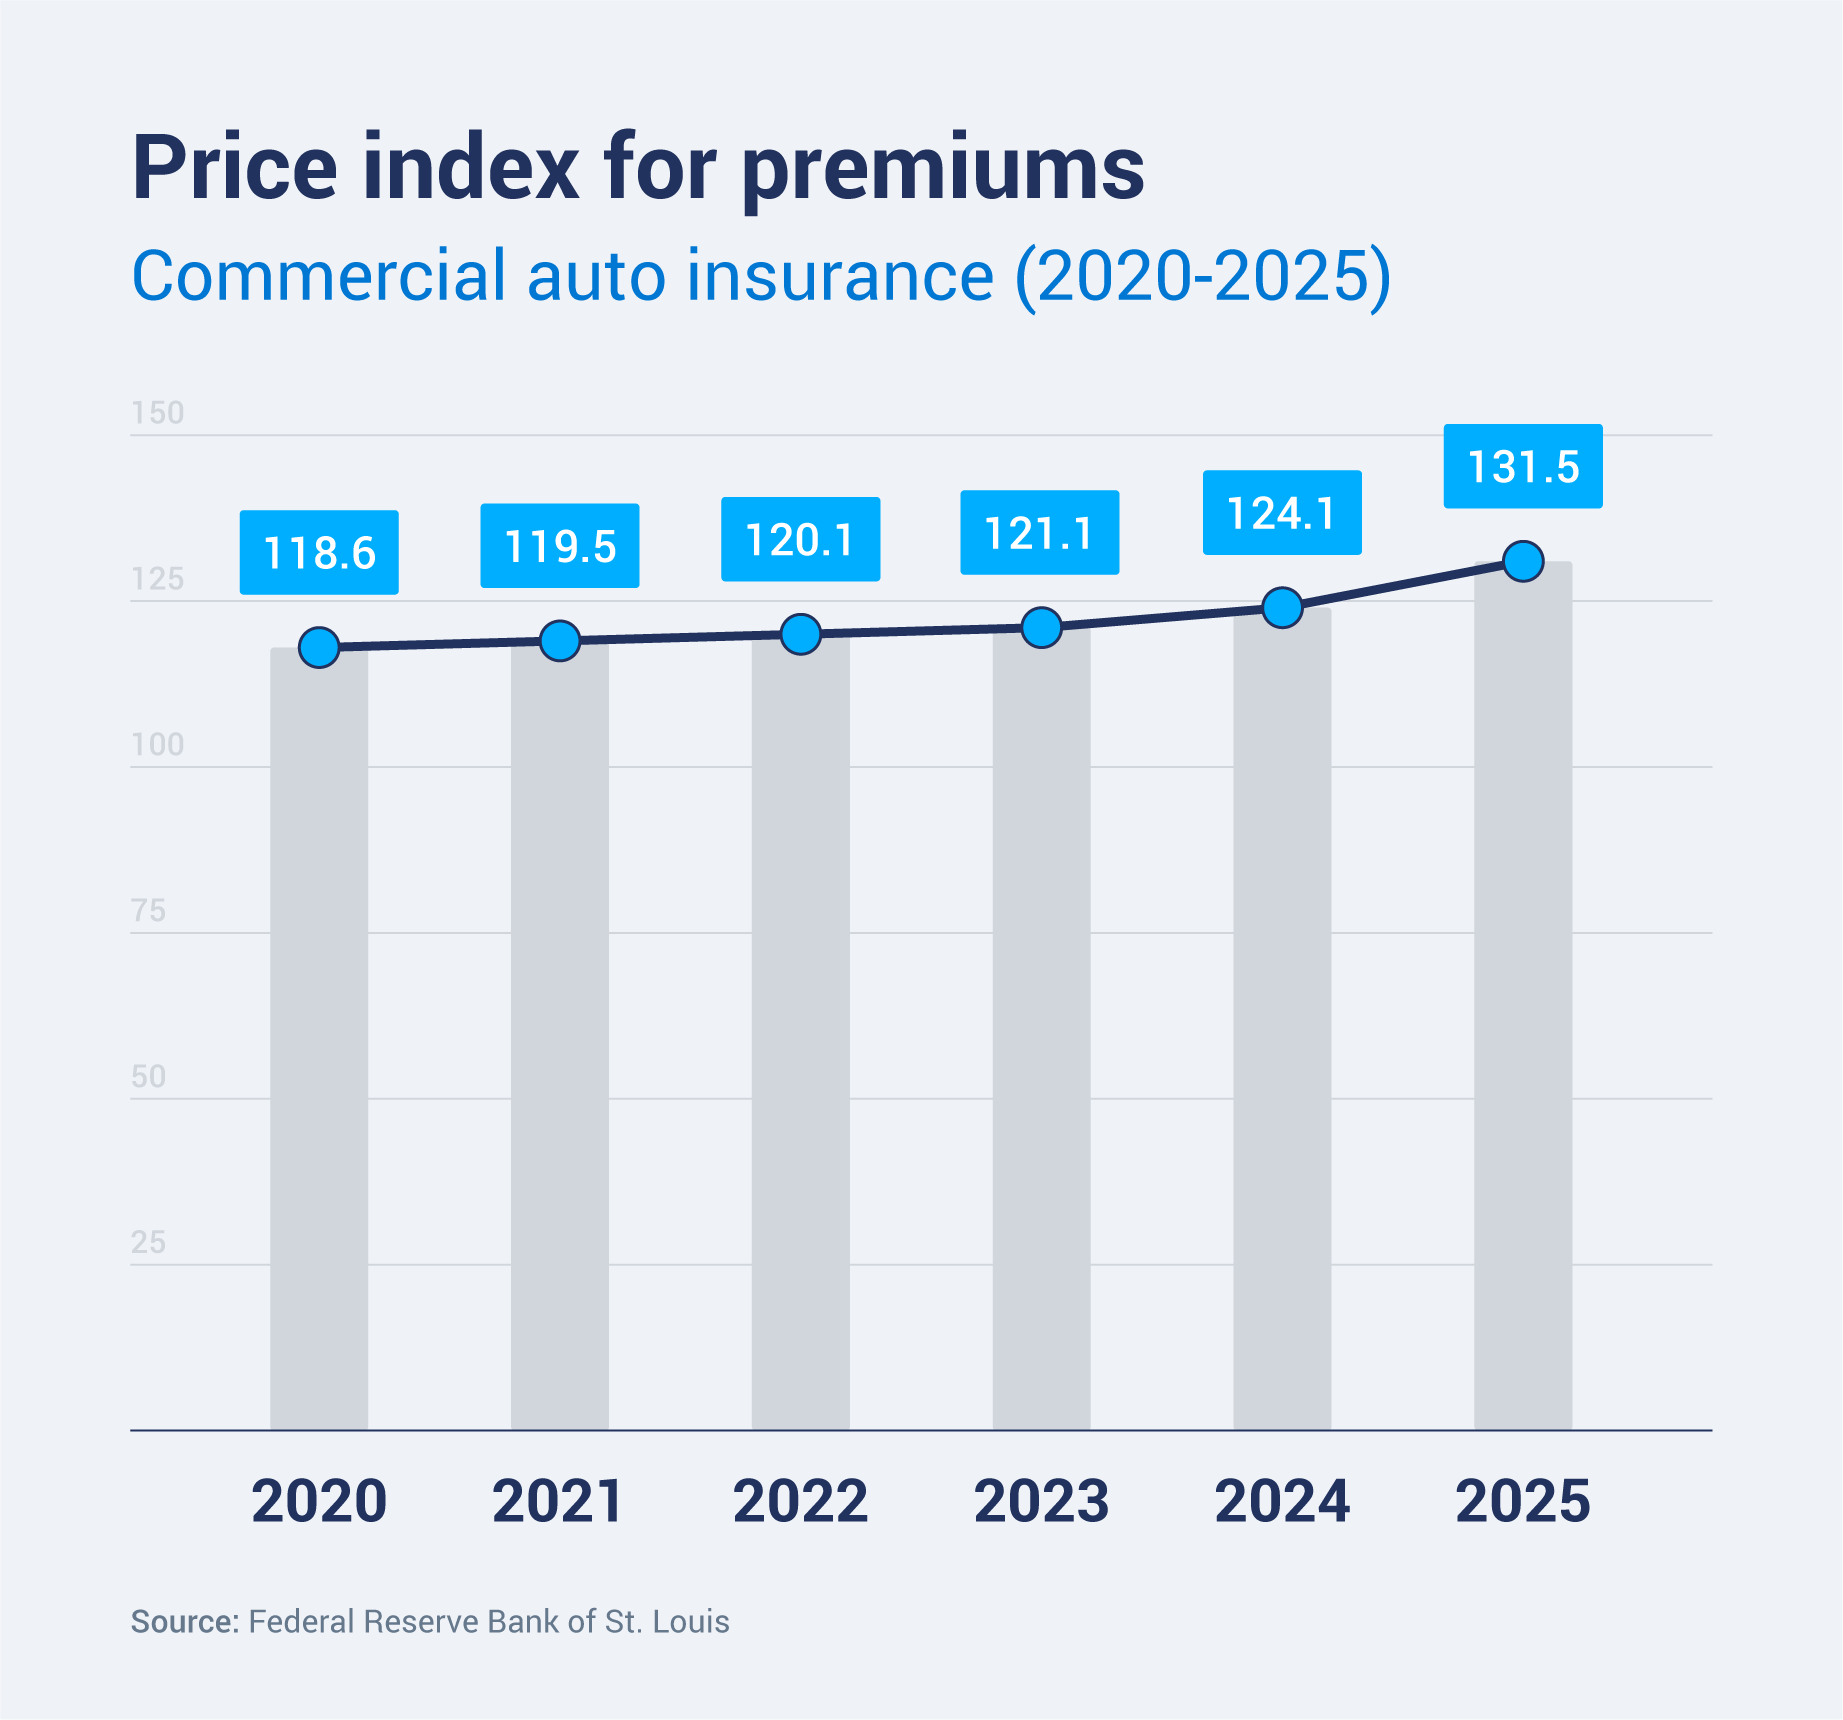
Commercial fleet insurance premiums rose by 9%-9.8%1 in the first half of 2024 alone. Pressure continued into 2025, with insurers projecting further increases of 5-15%, driven in part by a $30 billion surge in commercial auto claim costs. At the same time, increased highway exposure and broader risk-sharing have pushed collision and repair costs even higher.
Amid shrinking profit margins, fleet executives expect commercial fleet safety programs to pay for themselves by showing measurable losses avoided. This pressure makes ROI the language of leadership and the standard for evaluating every safety dollar spent.
Turns real-time data into proactive risk prevention
Fleets are moving away from reactive incident logs to AI‑driven predictive analytics. Predictive analytics uses historical and real‑time data to forecast future collision probability.
Geotab’s Safety Overview helps fleets identify high-risk drivers before a collision occurs with Driver Risk Insights that assign each driver a risk probability and benchmarks them against peers. Customers using the Safety Overview have seen a 5.5% reduction in collision rates in just four months of use. With live fleet incident reporting, managers can act early to reduce risk instead of reacting after an incident.
Builds internal trust and buy-in
Demonstrating measurable improvements in fleet safety metrics builds credibility across the organization. It shows that safety investments deliver value beyond fleet compliance management by supporting financial performance and workforce well-being. Examples include:
- Fewer collisions reported across the fleet
- Lower claims frequency and faster resolution
- Reduced insurance costs year over year
When fleet leaders share a common view of results, it becomes easier to align on budgets and priorities. This alignment creates a culture of accountability where safety is seen as a driver of efficiency, not just a regulatory requirement.
Tools that make progress visible and actionable include:
- Driver scorecards that track individual performance
- Trend dashboards that highlight long-term improvement
- Incident heatmaps that identify problem areas
By sharing these insights in regular reviews, managers can highlight wins, identify new risks and secure continued leadership support for future safety initiatives. A#1 Air, a Texas-based HVAC company with 138 service vehicles, used Geotab driver scorecard data to negotiate lower premiums, presenting the data directly to their insurance agency as proof of safe driving.
Helps fleets build a foundation for long-term growth
A proven safety track record pays dividends over time. Lower collision rates help secure better insurance terms, smooth audit outcomes and strengthen your brand’s trust among customers and drivers.
Safety-savvy fleets also attract and retain better drivers, especially in a tight labor market. Meeting evolving compliance needs, from Hours of Service (HOS) to driver-vehicle inspection reports (DVIRs) and emissions, becomes easier with proactive systems.
Formula to calculate fleet safety ROI
In ROI fleet management, the key is to keep calculations simple and consistent. Use the same cost and savings categories each time and measure performance over a standard period, usually 12 months. This makes results easier to track and explain to executives and aligns with best practices explained in Geotab’s fleet safety insights.
Step-by-step equations
- ROI = (Total benefits − Program cost) ÷ Program cost
- Payback period = Program cost ÷ Monthly net savings
- Monthly net savings = Monthly benefits − Monthly ongoing costs
How it works
- Total benefits should include reduced collision costs, lower insurance premiums, fewer repairs and faster claims handling.
- Program cost covers both direct costs (hardware, installation, training) and indirect costs (downtime, internal admin time).
If a fleet invests $50,000 in safety technology and saves $150,000 in reduced collisions and insurance costs over 12 months:
- ROI = ($150,000 − $50,000) ÷ $50,000 = 2.0 or 200% ROI
- Payback period = $50,000 ÷ $12,500 monthly net savings = 4 months
This means the fleet recoups its investment within four months and generates ongoing savings for the rest of the year.
| Pro tip: Keep costs net of tax incentives and grants, and separate one-time setup costs from ongoing expenses to make ROI comparisons accurate. |
Skip the manual math
The Geotab Fleet Management ROI Calculator gives you a personalized savings breakdown in under 60 seconds. Input your fleet size, annual mileage, idle time and annual collision count and see exactly how much you could save across safety, fuel, maintenance and optimization. Try the calculator here.
Key steps to prove fleet safety ROI
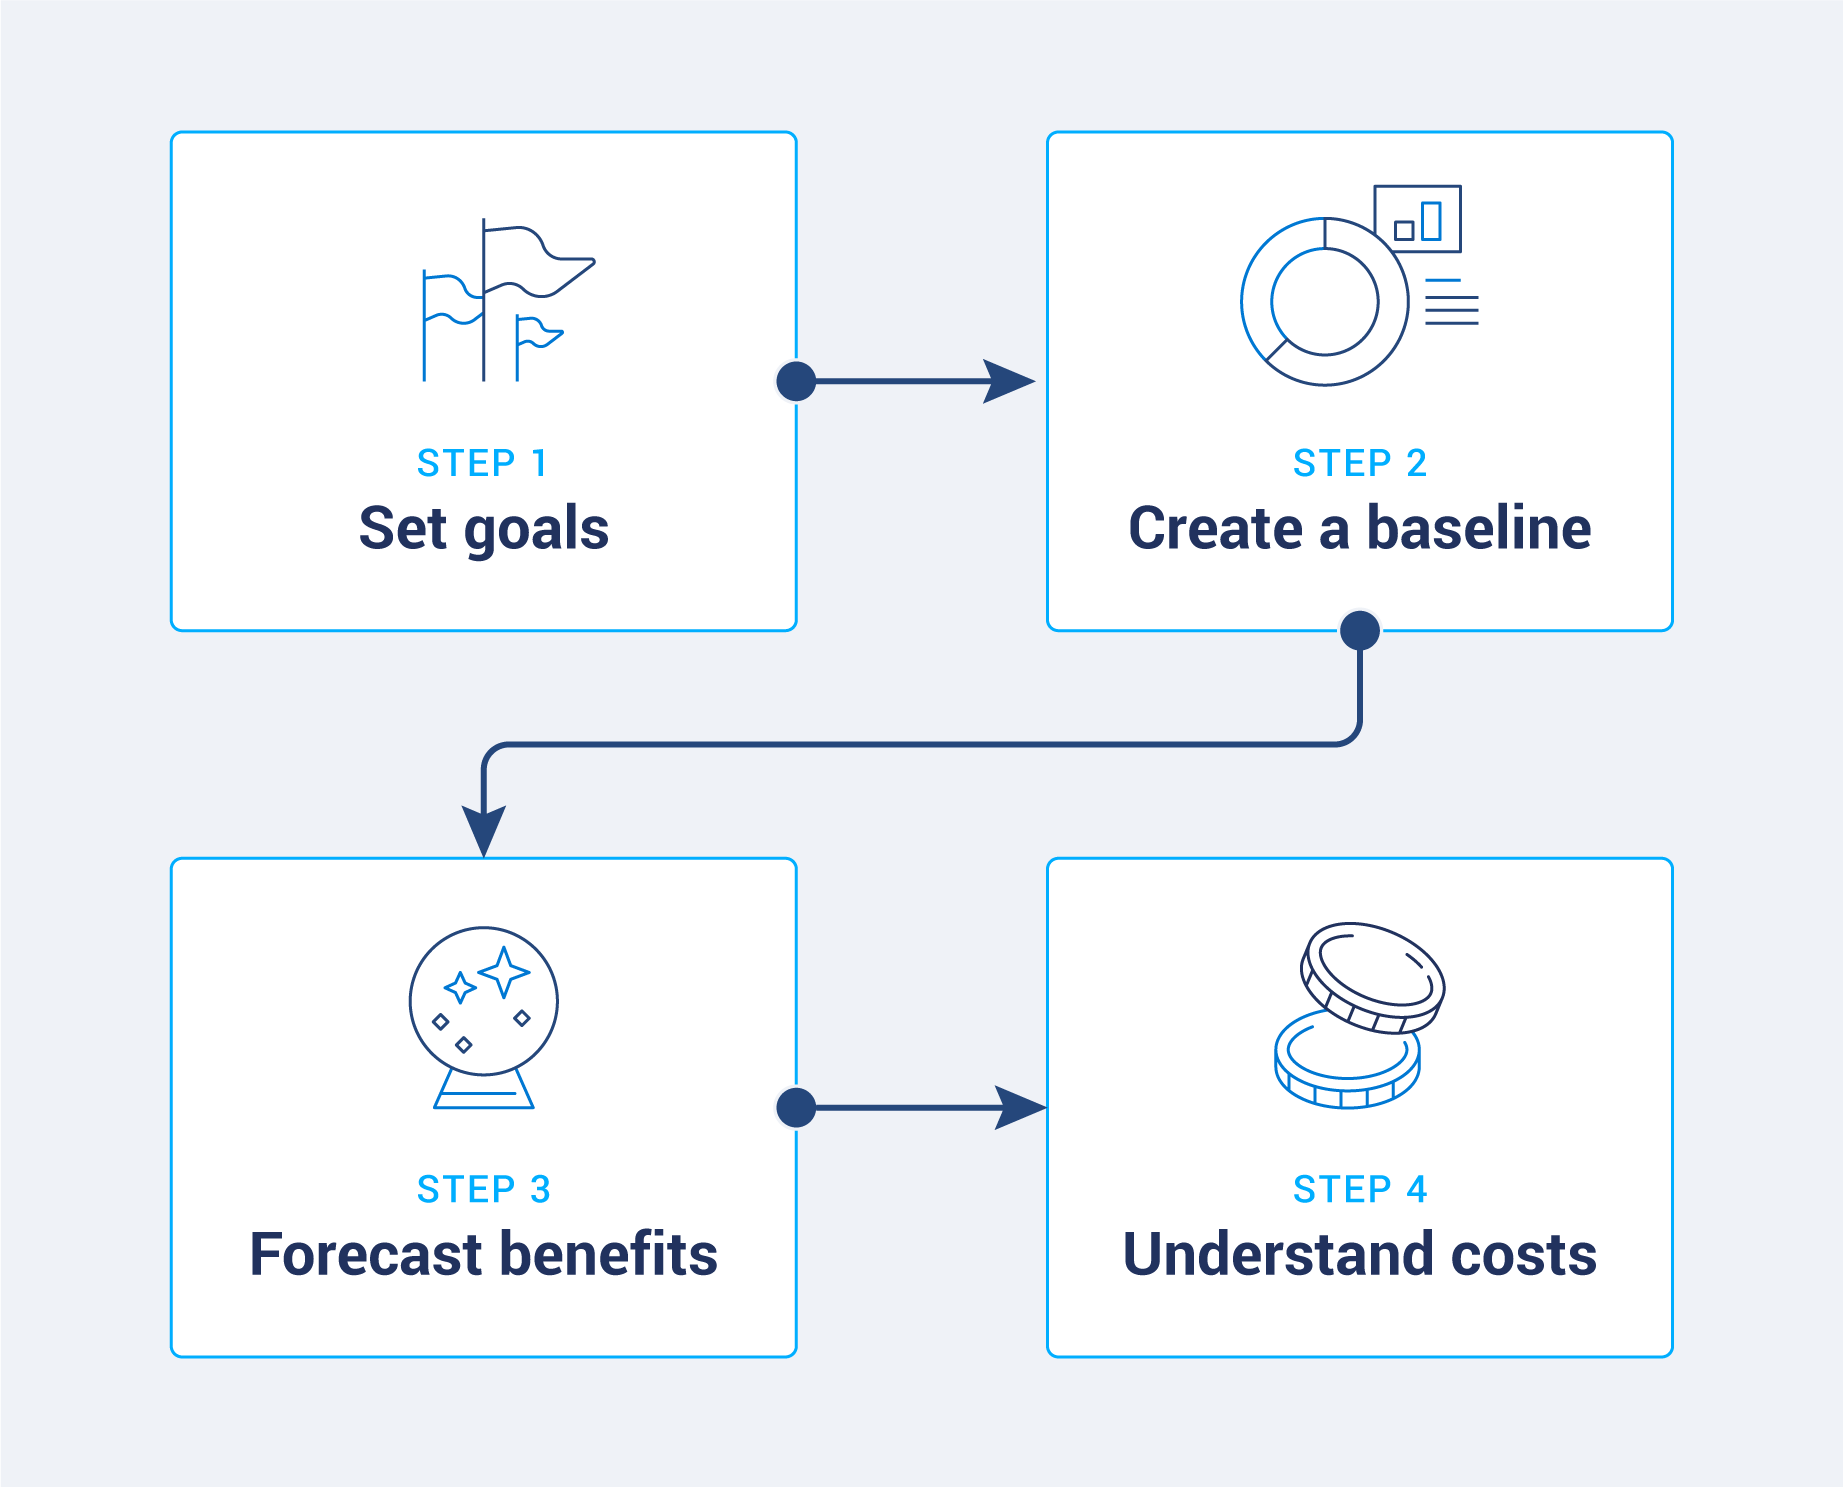
Proving ROI starts with accurate data and a clear understanding of both costs and benefits. These four steps will help you measure impact and build a strong business case:
1. Define the problem and set measurable goals
Identify your biggest challenges, such as frequent collisions, rising insurance premiums, high driver turnover or excessive maintenance costs. Then, set clear targets.
| Example: Aim to reduce preventable collisions by 20% within the next 12 months or cut insurance costs by 10% in two years. |
2. Establish your baseline
Before making changes, capture a snapshot of your current performance. Collect at least 12 months’ worth of historical data on:
- Number and severity of collisions
- Insurance premiums and claims costs
- Maintenance and fuel expenses
- Driver turnover rates
This baseline will be your benchmark for measuring improvement.
3. Understand the full cost of safety investments
Account for every expense tied to safety initiatives, like:
- Direct costs: Hardware purchases, installation fees, software licenses and driver training programs
- Indirect costs: Vehicle downtime during installation, time spent by internal staff on implementation and change management efforts
Accurate cost tracking helps ensure ROI calculations are credible.
4. Forecast quantifiable and intangible benefits
Estimate the return you expect from safety investments. Include:
- Hard-dollar savings: Reduced collision costs, lower insurance premiums, faster claims processing and fewer repair expenses
- Intangible benefits: Improved brand reputation, stronger driver retention and better compliance with regulations
By weighing both tangible and intangible benefits against total costs, you can present a complete picture of value.
Top ROI metrics for fleet driver safety
Tracking the right fleet safety metrics ensures you can measure the impact of safety programs and make informed decisions.
Metrics fall into two categories: leading indicators that predict future risk, and lagging indicators that confirm results after incidents occur.
Leading indicators
Leading indicators identify potential safety issues before they result in collisions. These proactive measures give managers time to coach and correct. Examples of leading indicators include:
- Harsh events: These are instances of harsh braking, acceleration or cornering per 1,000 miles. Fleets should aim for fewer than 15 per 1,000 miles.
- Near misses: These refer to incidents where a collision was narrowly avoided, often captured by telematics data or dash cam review. A good benchmark is fewer than five per 1,000 miles.
- Risk score: This driver-level score predicts the likelihood of a collision based on historical behavior and real-time data. Fleets using Geotab’s Risk Analytics tools see a 5.5% reduction in predicted collisions, translating directly to fewer incidents and lower costs.
In Geotab’s Safety Overview, each driver is assigned a collision risk probability calculated from a mix of event frequency, severity and contextual factors such as road type and time of day.
This allows managers to prioritize coaching for the drivers most likely to be involved in a collision, making safety programs more efficient and cost-effective.
| Pro tip: Pairing these metrics with a fleet safety grader provides a snapshot score that simplifies communication with executives and insurers. |
Lagging indicators
Lagging indicators measure actual outcomes over a set period. They validate whether proactive safety measures are working and help demonstrate value to executives and insurers.
- Collision rate: This refers to the number of collisions per 100,000 miles driven. Top-performing fleets target below 0.07 per 100,000 miles.
- CSA score: This score represents the Compliance, Safety, Accountability BASICs used by the FMCSA to evaluate safety performance. The lower the score, the better, but best-in-class fleets keep all BASIC categories under 50. Learn more about CSA scores.
- Commercial truck insurance cost per mile: This is the total insurance premium divided by the total miles driven.
By pairing leading and lagging indicators, fleets create a balanced scorecard for safety performance. Leading metrics help prevent incidents, while lagging metrics confirm improvements and build a strong ROI case for executives, insurers and regulators.
Real benchmarks to gauge safety performance
To prove ROI, fleets need context. Benchmarks allow you to compare your results with peer groups by fleet size, vehicle type and industry. These comparisons show whether your safety program is average, lagging or among top performers. Reliable fleet safety tracking is what makes these comparisons possible.
Here are some benchmarks to know:
Collision rate and severity by industry and fleet size
Collision frequency and severity vary widely across vehicle classes and industries. Light-duty fleets typically experience higher frequency but lower severity incidents, while heavy-duty fleets face fewer but more costly collisions.
CSA scores and cost per mile
Insurance costs provide another reliable benchmark. The national average sits at approximately $0.07 per mile, while top-quartile fleets achieve approximately $0.06 per mile or less. Lower costs per mile reflect fewer collisions, proactive claims handling and stronger safety programs.
In terms of CSA score performance, industry leaders target an Unsafe Driving BASIC score under 50. Continuous monitoring of CSA scores gives fleets leverage with insurers and strengthens their ROI story.
What top-quartile fleets achieve
Top-quartile fleets consistently demonstrate the ROI of safety by outperforming industry averages. They report:
- 40% reduction in collision rates for fleets using Geotab safety features, according to the 2024 State of Commercial Transportation Report
- 9-point CSA improvement year over year
- 10% premium rebate from insurers participating in verified telematics discount programs
These results are reflected in real customer outcomes. Richfords Fire and Flood dispatches 53 service vehicles to time-critical emergency callouts. After implementing a structured driver safety program, the company reported a 411% ROI, including a 22% reduction in predictive collision rate and 59% improvement across speeding, harsh braking and cornering behaviors. Richfords also shared its improved risk profile with its insurance broker ahead of its next renewal.
Red Hawk Fire & Security reduced collisions by 80% in its Northeast Region after implementing telematics-driven driver coaching. Tolt Solutions cut their collision rate by 21% year over year across 470 vehicles. For field service fleets, where technicians are the revenue-generating asset, every collision avoided is a missed appointment prevented.
These benchmarks show what’s possible when fleets use predictive safety analytics, targeted driver coaching and continuous improvement practices.
How to maximize your fleet’s safety ROI
Turning data into action is the key to improving fleet management service ROI. These strategies help you apply analytics consistently and keep safety gains growing year after year. In particular, optimizing your fleet safety program with AI allows managers to predict risks earlier, coach drivers more effectively and sustain long-term results.
Here’s how to maximize your fleet’s safety ROI in four steps:
1. Connect your telematics software
Using telematics is key to getting the most out of your ROI. Integrate your telematics platform with a business intelligence (BI) dashboard to create live scorecards that track safety performance in real time.
Tools like the Geotab Data Connector make it simple to connect to Power BI or Tableau, so leadership can view updated KPIs at any time.
Update dashboards daily to maintain executive engagement and ensure operational decisions are based on the most current data. This real-time visibility helps identify emerging risks, track driver performance and measure the direct impact of safety investments.
2. Prioritize coaching with driver-level risk probability
Focus your safety resources where they will have the greatest impact. Using driver-level risk probability, assign coaching sessions to the top 20% of high-risk drivers first. This targeted approach addresses the behaviors most likely to lead to collisions.
Many fleets adopt strategies from field service driver coaching programs, which emphasize focusing on the most at-risk drivers and tailoring sessions to their specific behaviors.
For context, the fleet risk management guide shows how structured coaching fits into a larger safety framework that balances technology, policy and culture.
Fleets that prioritize high-risk drivers in their coaching program can reduce collision rates significantly. Incorporating personalized coaching and follow-up reviews also improves driver engagement and reinforces safer habits.
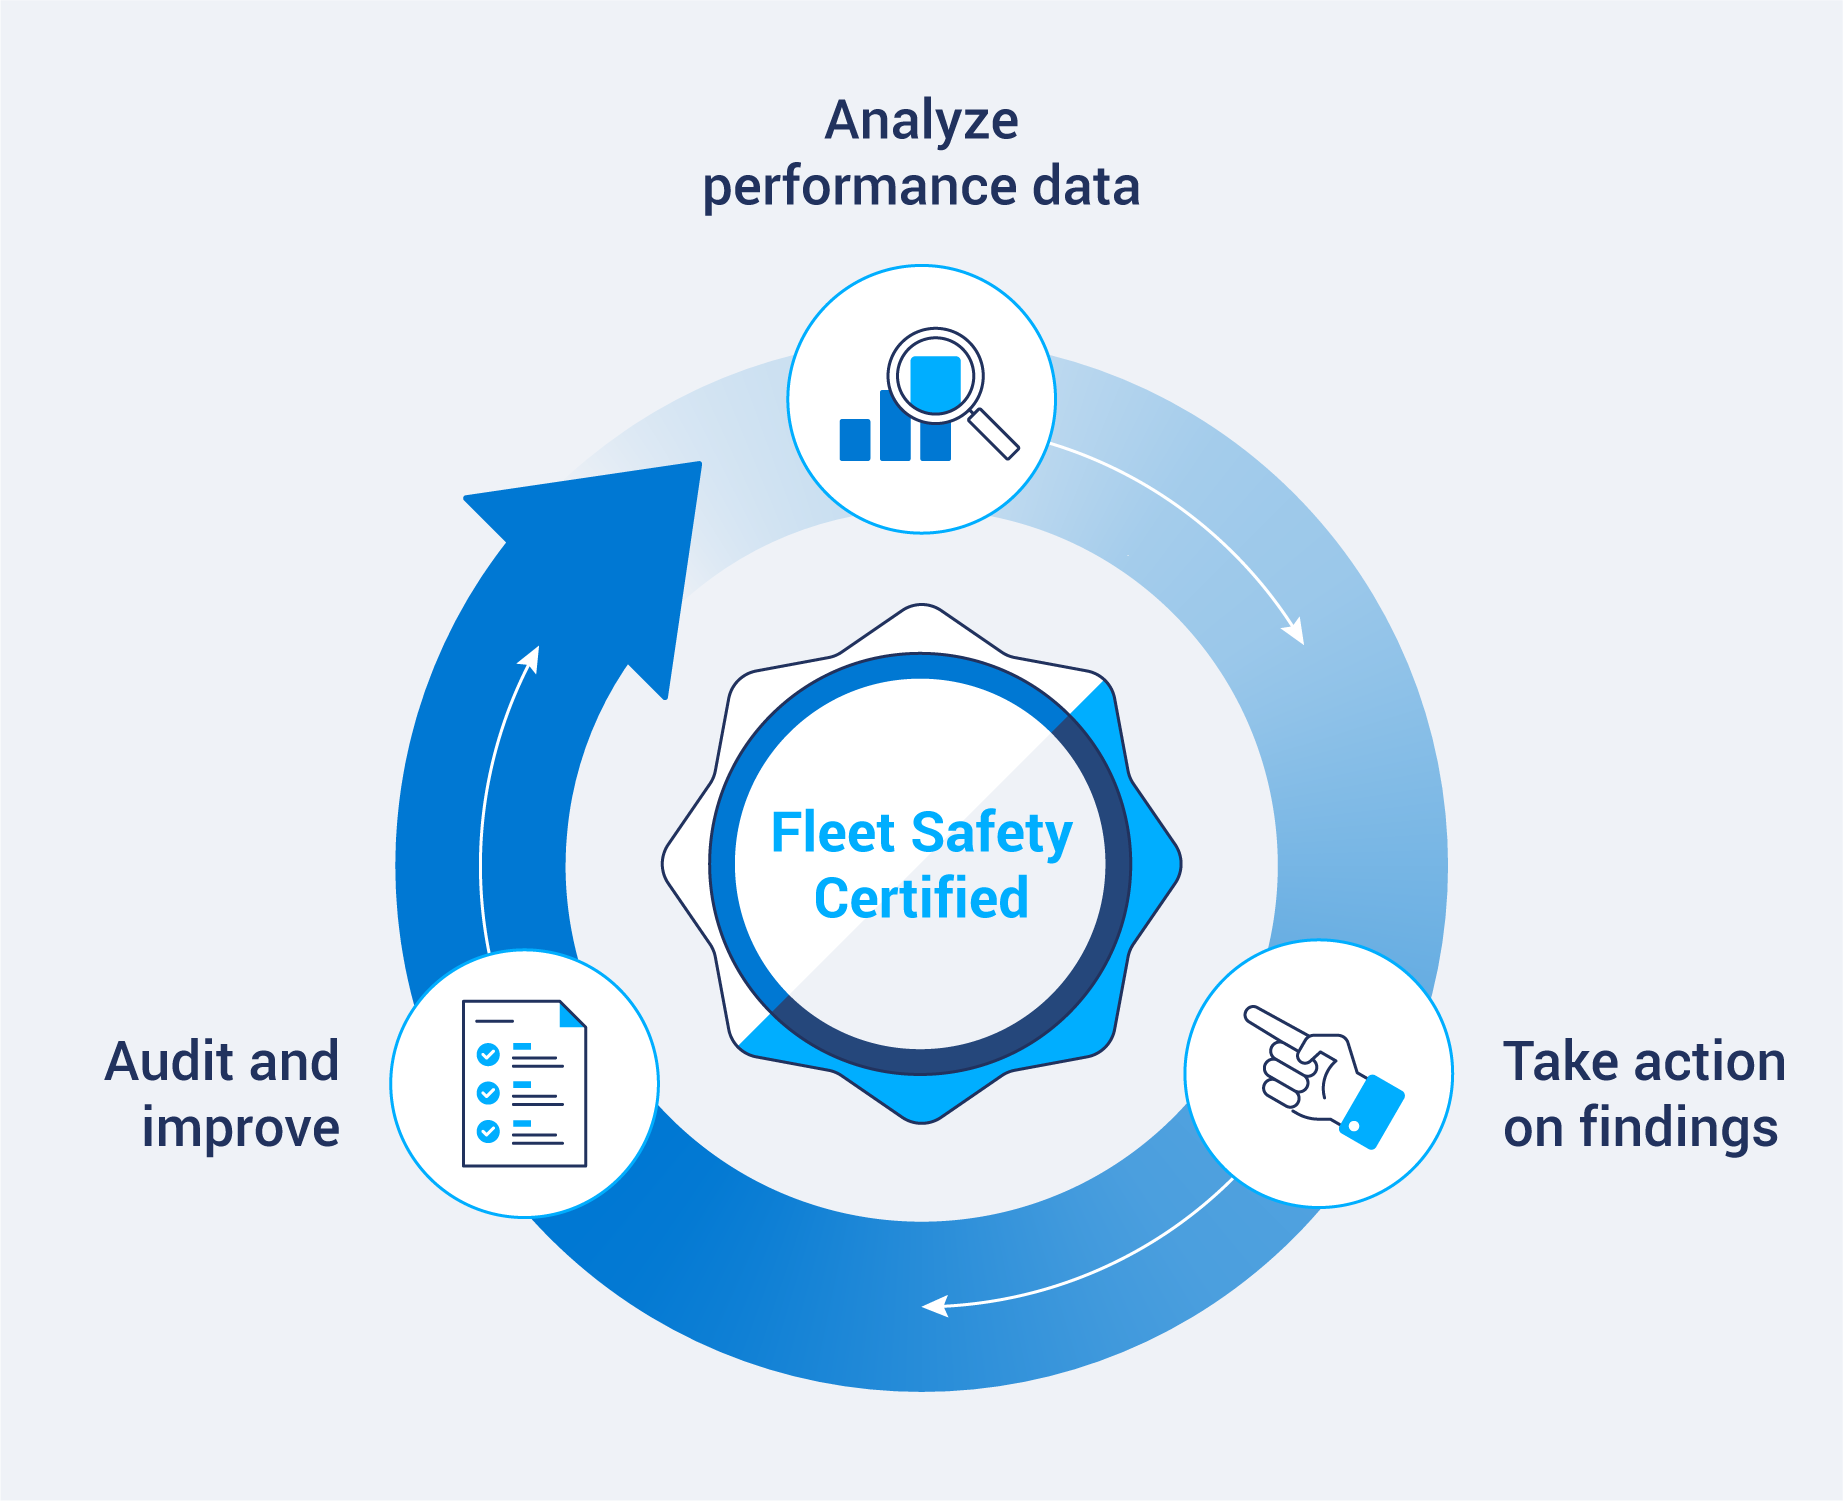
3. Build a continuous improvement loop with quarterly reviews
Establish a three-step cycle to keep ROI trending upward:
- Analyze performance data and identify patterns or outliers.
- Act on findings by updating training, technology settings or policies.
- Audit results to confirm improvements and uncover new opportunities.
Review KPIs quarterly, set measurable targets and celebrate progress to keep teams motivated. Consistent reviews also ensure compliance with safety and operational standards, which strengthens your position during audits and supports your path to becoming fleet safety certified.
4. Reduce collision exposure through route optimization
One of the most overlooked variables in fleet safety ROI is how many miles your drivers cover. Collision rates are measured per miles driven. Fewer miles on the road means fewer incidents, even before a single coaching session runs or a safety alert fires.
Route optimization reduces exposure directly. Smarter routing cuts unnecessary miles and limits time in high-risk urban traffic. It also reduces low-speed backing maneuvers, one of the most common sources of at-fault incidents for service fleets. The result is a lower collision rate that reflects operational efficiency as much as driver behavior.
Field services fleets can use Geotab’s field service routing ROI calculator to see how many miles your fleet could remove from the road — and how that reduction translates to lower collision exposure and measurable cost savings.
Build a long-term ROI-driven fleet safety strategy with Geotab
Quantifying fleet safety ROI is no longer optional. Rising premiums, repair costs and operational pressures demand a clear business case for every safety investment. By tracking the right metrics, applying proven formulas and benchmarking against top performers, fleets can show measurable financial returns alongside safer operations.
Now is the time to turn your safety data into a business advantage. For a personalized safety savings estimate, use the Geotab fleet management ROI calculator. Input your collision data and see the direct financial impact of a safer fleet.
Subscribe to get industry tips and insights
Frequently Asked Questions
Collision rate per 100,000 miles, insurance cost per mile and claims frequency are top indicators. Leading metrics like harsh events, near-miss counts and driver risk scores help track improvement before incidents happen.
Dash cams provide objective video evidence that can exonerate drivers, reduce false claims and speed up settlements. They also support coaching programs that improve driver behavior, helping lower collision rates over time.
Most fleets break even within 12 to 18 months2 when factoring in device installation, training and premium rebates.
Carriers typically accept timestamped telematics logs, driver scorecards and verified collision video footage as audit-ready evidence of improved safety performance.
EV fleets often achieve faster ROI due to lower fuel and maintenance costs, while safety improvements remain consistent across both electric and internal combustion engine (ICE) vehicles.
Statistically valid benchmarking starts at around 50 vehicles, but predictive analytics models become more accurate after 100,000 cumulative miles of collected data.
Geotab’s fleet safety checklist is a simple but powerful way to track training, inspections and policy adherence. Combined with telematics data, it helps managers verify that every element of the safety program is in place.
The Geotab Team write about company news.
Table of Contents
Subscribe to get industry tips and insights
Related posts



Fleet accident management: How to improve safety and reduce costs
September 4, 2026
5 minute read

Driver risk management: How public fleet managers save time with smarter video tools
September 2, 2026
3 minute read

How video telematics helps drivers trust the safety program
August 27, 2026
4 minute read

Lone worker safety for utility fleets: A checklist for the sites beyond cellular reach
August 24, 2026
3 minute read